Directions: Read the following Pie chart carefully and answer the following questions:-
The pie chart shows the percentage of candidates in 6 different shifts of an examination.
Total number of candidates = 5500
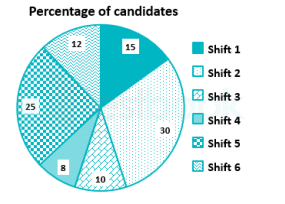
If 40% candidates in shift 6 were failed, then find the number of candidates passed the examination
in the same shift.
396
228
426
264
Step by step video & image solution for Directions: Read the following Pie chart carefully and answer the following questions:- The pie chart shows the percentage of candidates in 6 different shifts of an examination. Total number of candidates = 5500If 40% candidates in shift 6 were failed, then find the number of candidates passed the examination in the same shift. by Maths experts to help you in doubts & scoring excellent marks in Class 14 exams.
Similar Questions
Directions: Read the following Pie chart carefully and answer the following questions:- The pie chart shows the percentage of candidates in 6 different shifts of an examination. Total number of candidates = 5500
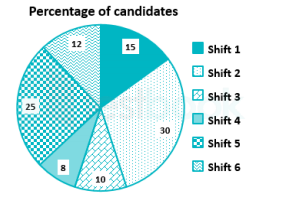
If 215 candidates in shift 2 were absent, then find the number of candidates present in the same shift.View SolutionDirections: Read the following Pie chart carefully and answer the following questions:- The pie chart shows the percentage of candidates in 6 different shifts of an examination. Total number of candidates = 5500
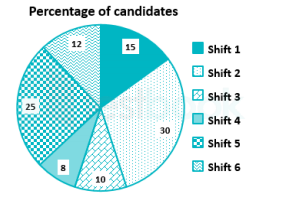
The number of candidates in shift 1 is how much more than the number of candidates in shift 4?View Solution
Knowledge Check
- Question 1 - Select One
The average of marks obtained by 100 candidates in a certain examination is 30. If the average marks of passed candidates is 35 and that of the failed candidates is 10, what is the number of candidates who passed the examination?
A60B70C80D90 - Question 2 - Select One
The average of marks obtained by 120 candidates in a certain examination is 35. If the average marks of passed candidates is 39 and that of the failed candidates is 15, what is the number of candidates who passed the examination?
A100B110C120D150 - Question 3 - Select One
Study the following graph carefully and answer the question given below
Number of candidates appeared (in thousand) and percentage of candidates qualified in a competitive examination over the years.
No. of candidates appeared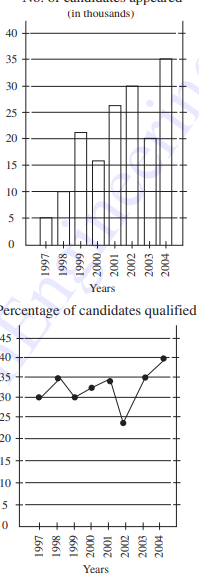
What was the percentage drop in thee number of candidates appeared from the year 2002 to 2003?A6623B30C70D3313
Directions: Read the following Pie chart carefully and answer the following questions:- The pie chart shows the percentage of candidates in 6 different shifts of an examination. Total number of candidates = 5500
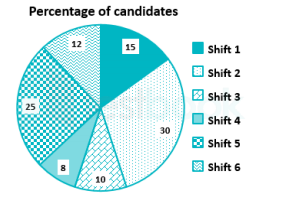
Number of candidates in shift 6 is what percentage more/less than number of candidate in shift 4?View SolutionDirections: Read the following Pie chart carefully and answer the following questions:- The pie chart shows the percentage of candidates in 6 different shifts of an examination. Total number of candidates = 5500
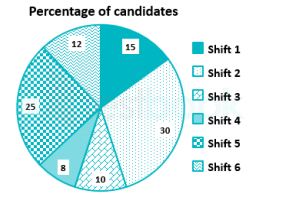
Find the average number of candidates in shift 2, shift 3 and shift 4 together in the examination.View SolutionDirections: Read the following Pie chart carefully and answer the following questions:- The pie chart shows the percentage of candidates in 6 different shifts of an examination. Total number of candidates = 5500
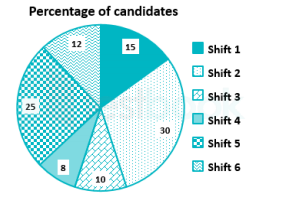
If ratio of male to female candidates in shift 3 is 6 : 5, then find number of female candidates in shift 3) 1) 350 2) 225View SolutionThe average of marks obtained by 120 candidates in a certain examination is 35. If the average marks of passed candidates is 39 and that of the failed candidates is 15, what is the number of candidates who passed the examination?
View SolutionThe average of marks obtained by 125 candidates in a certain examination is 29. If the average marks of passed candidates is 36 and that of the failed candidates is 11, what is the number of candidates who failed the examination ?
View Solution

