The data is given for 62 students in a certain class regarding their mathematics marks out of 100. Take the classes 0-10, 10-20.. and prepare frequency distribution table and cumulative frequency table more than or equal to type.
55, 60, 81, 90, 45, 65, 45, 52, 30, 85, 20, 10,
75, 95, 09, 20, 25, 39, 45, 50, 78, 70, 46, 64,
42, 58, 31, 82, 27, 11, 78, 97, 07, 22, 27, 36,
35, 40, 75, 80, 47, 69, 48, 59, 32, 83, 23, 17,
77, 45, 05, 23, 37, 38, 35, 25, 46, 57, 68, 45,
47, 49.
From the prepared table, answer the following questions :
How many students obtained marks 60 or above 60 ?
The correct Answer is:19
Similar Questions
Construct a frequency distribution table for each of the following distributions
Marks (more than) 0102030405060708090100 Cumulative Frequency 100876555423631211870
View SolutionConstruct a frequency distribution table for each of the following distributions
Marks (less than) 0102030405060708090100 Cumulative Frequency 0728547184105147180196200
View Solution
Knowledge Check
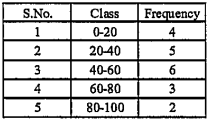
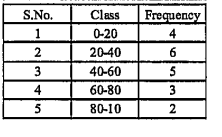
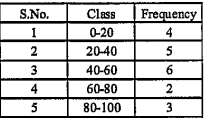
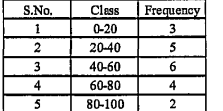
20 students of a class obtained following respective marks out of 100 marks in subject Mathematics:54,46,24,36,84,70,16,58,6,82,44,54.32,64.8,66,52,28,16 and 30 Grouped frequency distribution table of above will be
A B
B C
C D
D
The class marks in a frequency table are given to be 5, 10, 15, 20, 25, 30, 35, 40, 45, 50 The class limits of the first five classes are
A3-7,7-13, 13-17, 17-23, 23-27B2.5-7.5,7.5-12.5, 12.5-17.5, 1.75-22.5, 22.5-27.5C1.5-8.5 8.5-11.5, 11.5-18.5, 18.5-21.5, 21.5-28.5D2-8.8-12 12-18, 18-22, 22-28
Construct a frequency distribution table from the following cumulative frequency distribution :
Calss IntervalFrequency5−101810−153015−204620−257325−3090
View SolutionFor the following frequency distribution draw a cumulative frequency curve of 'more than type' and hence obtain the median value [Class0−1010−2020−3030−4040−5050−6060−70Frequency515202317119]
View SolutionFollowing are the marks obtained by 30 students in a examination

Taking class intervals 0−10,10−20,…..40−50 construct a frequency table.
View SolutionFollowing are the marks obtained by 30 students in a examination

Taking class intervals 0−10,10−20,…..40−50 construct a frequency table.
View SolutionGiven below is a cumulative frequency distribution showing the mars secured by 50 students of a class

From the frequency distribution table for the data.
View SolutionGiven below is a cumulative frequency distribution showing the mars secured by 50 students of a class

From the frequency distribution table for the data.
View Solution
