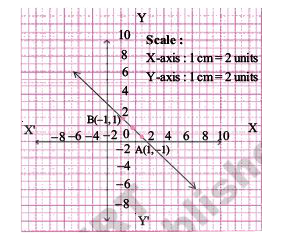
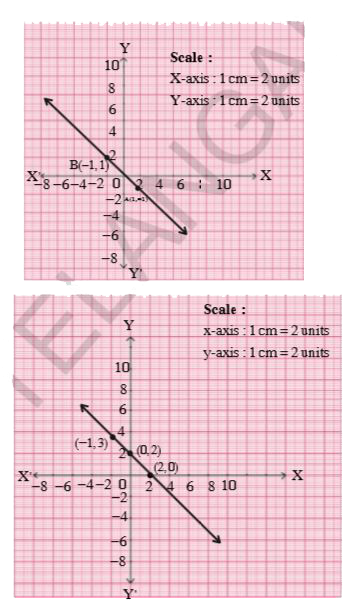
For each graph given below, four linear equations are given. Out of these find the equation that represents the given graph.
Equations are
(A) y=x (B) x+y=0 (C ) y=2x (D) 2+3y=7x
 Solution in Telugu
The correct Answer is:So, they are not the required equations.
Step by step video, text & image solution for For each graph given below, four linear equations are given. Out of these find the equation that represents the given graph. Equations are (A) y=x (B) x+y=0 (C ) y=2x (D) 2+ 3y=7x by Maths experts to help you in doubts & scoring excellent marks in Class 9 exams.
Updated on:21/07/2023Similar Questions
The equation of graph shown in figure is y=2x2. The slope of graph at point P is :
ltimg src="https://d10lpgp6xz60nq.cloudfront.net/physics_images/ALN_PHY_R04_E01_023_Q01.png" width="80%"gt
View SolutionIf y-x=180^(@) then find the values of x and y. ltimg src="https://d10lpgp6xz60nq.cloudfront.net/physics_images/ALN_PHY_R05_E01_034_Q01.png" width="80%"gt
View SolutionFor each graph given below, four linear equations are given. Out of these find the equation that represents the given graph.
(i) Equations are
(A) y = x
(B) x + y = 0
(C) y = 2x
(D) 2 + 3y = 7x
(ii) Equations are
(A) y = x + 2
(B) y = x - 2
(C) y = -x + 2
(D) x + 2y = 6

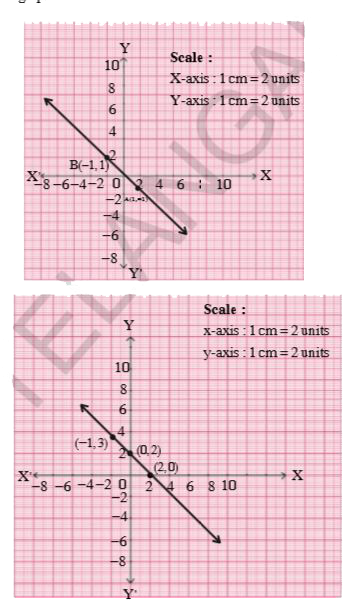
View SolutionFor each graph given below, four linear equations are given. Out of these find the equation that represents the given graph.
(i) Equations are
(A) y = x
(B) x + y = 0
(C) y = 2x
(D) 2 + 3y = 7x
(ii) Equations are
(A) y = x + 2
(B) y = x - 2
(C) y = -x + 2
(D) x + 2y = 6

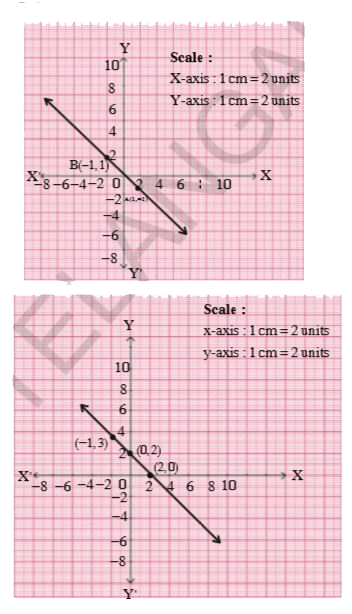
View SolutionFor each graph given below, four linear equations are given. Out of these find the equation that represents the given graph.
(i) Equations are
(A) y = x
(B) x + y = 0
(C) y = 2x
(D) 2 + 3y = 7x
(ii) Equations are
(A) y = x + 2
(B) y = x - 2
(C) y = -x + 2
(D) x + 2y = 6

View SolutionFor each graph given below, four linear equations are given. Out of these find the equation that represents the given graph.
(i) Equations are
(A) y = x
(B) x + y = 0
(C) y = 2x
(D) 2 + 3y = 7x
(ii) Equations are
(A) y = x + 2
(B) y = x - 2
(C) y = -x + 2
(D) x + 2y = 6

View SolutionThe equation of graph shown in figure is y=2x2. The slope of graph at point P is :
ltimg src="https://d10lpgp6xz60nq.cloudfront.net/physics_images/ALN_PHY_R04_E01_023_Q01.png" width="80%"gt
View SolutionThe equation of graph shown in figure is y=2x2. The slope of graph at point P is :
ltimg src="https://d10lpgp6xz60nq.cloudfront.net/physics_images/ALN_PHY_R04_E01_023_Q01.png" width="80%"gt
View Solution