The equation of graph shown in figure is y=2x2. The slope of graph at point P is :
ltimg src="https://d10lpgp6xz60nq.cloudfront.net/physics_images/ALN_PHY_R04_E01_023_Q01.png" width="80%"gtSolution in Gujrati
1
2
3
4
The correct Answer is:D
Step by step video & image solution for The equation of graph shown in figure is y=2x^(2). The slope of graph at point P is : ltimg src="https://d10lpgp6xz60nq.cloudfront.net/physics_images/ALN_PHY_R04_E01_023_Q01.png" width="80%"gt by Physics experts to help you in doubts & scoring excellent marks in Class 12 exams.
Updated on:21/07/2023Topper's Solved these Questions
- RACEBOOK - ALLEN CHAPTER - RACEEXERCISE - Basic Maths (Co-ordinate & Algebra)
40 Videos
- RACEBOOK - ALLEN CHAPTER - RACEEXERCISE - Basic Maths (VECTORS)
62 Videos
- RACEBOOK - ALLEN CHAPTER - RACEEXERCISE - Basic Maths (Integration)
12 Videos
- NEWTONS LAWS OF MOTIONBOOK - ALLEN CHAPTER - NEWTONS LAWS OF MOTIONEXERCISE - EXERCISE-III
28 Videos
- SIMPLE HARMONIC MOTIONBOOK - ALLEN CHAPTER - SIMPLE HARMONIC MOTIONEXERCISE - Example
1 Videos
Similar Questions
Find the value of :-
(i)√4
(ii)√9
(iii)√16
(iv)sqrt(36)
View SolutionState whether the following relations are true or false
(1)−−→AB=−−→BA
(2)−−→AB=−−−→BA
(3)∣∣∣−−→AB∣∣∣=∣∣∣−−→BA∣∣∣
(4)∣∣∣−−→AB∣∣∣=∣∣∣−−−→AB∣∣∣
(5)ˆj=ˆk
(6)∣∣ˆj∣∣=∣∣ˆk∣∣
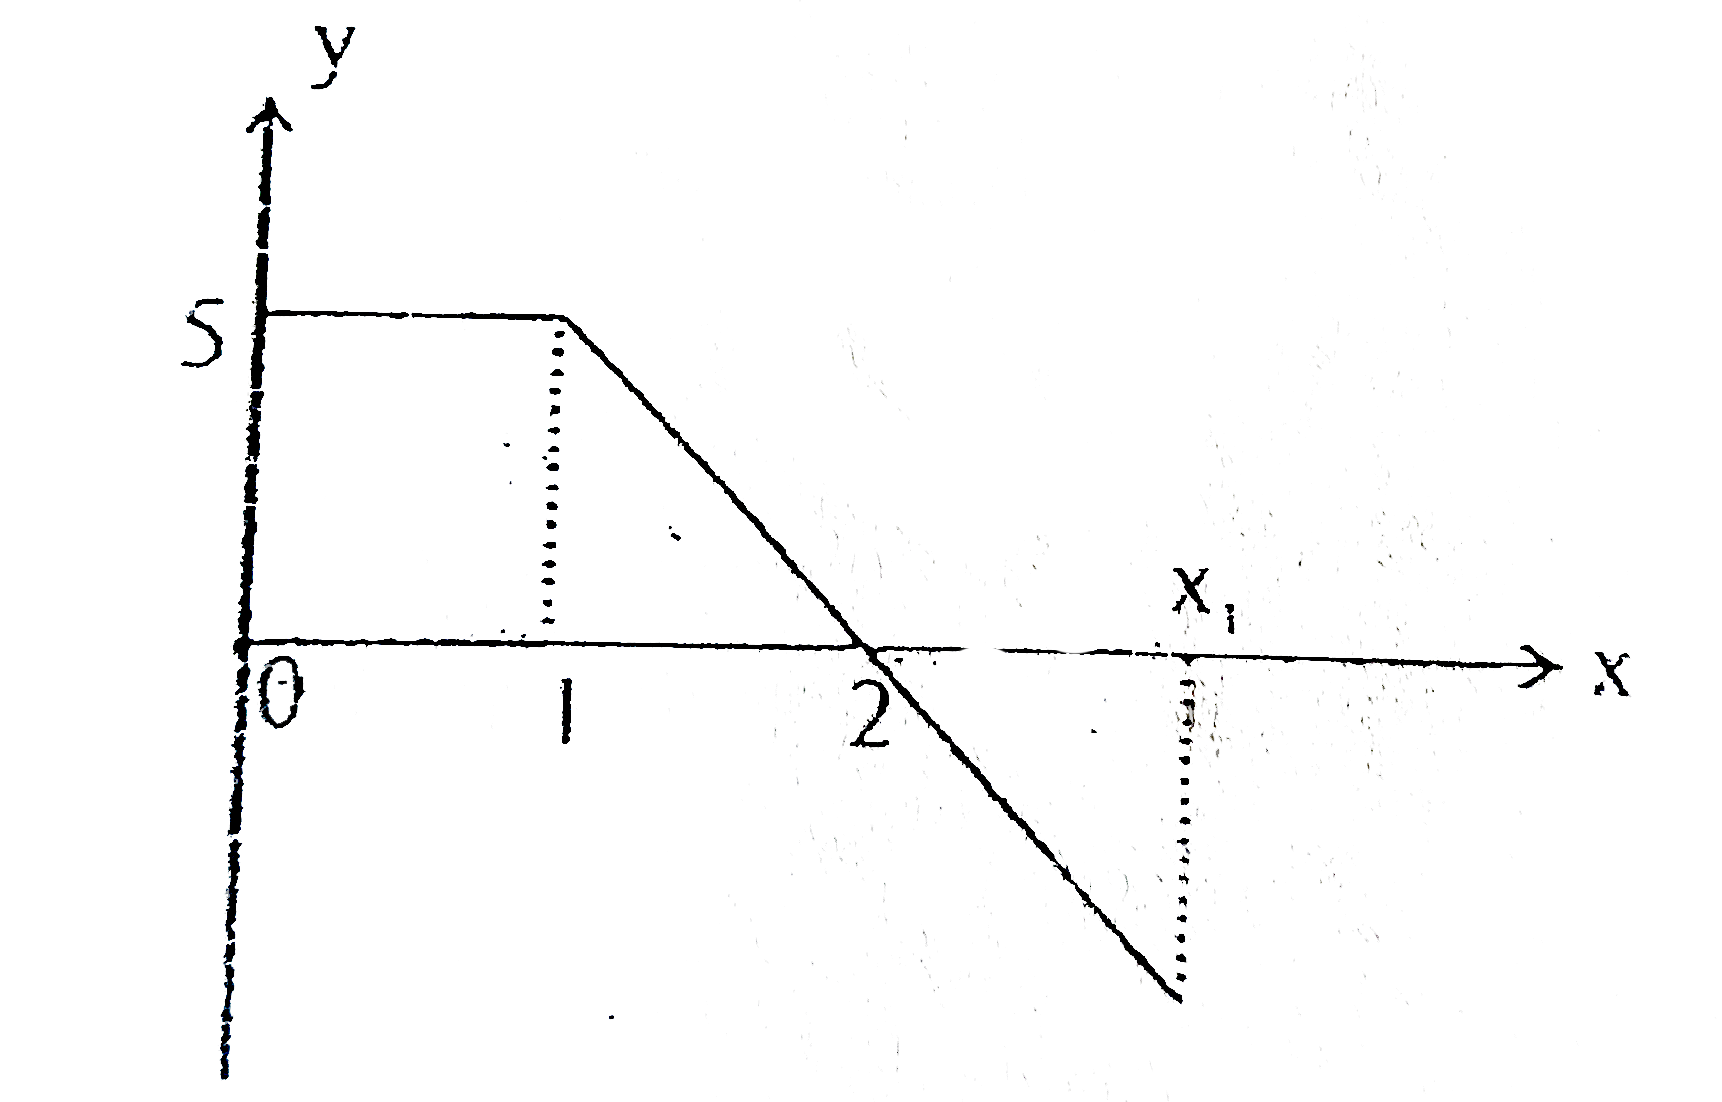
View SolutionFind the value of x1, so that ∫x10ydx=5
View SolutionAssertion: The driver in a vechicle moving with a constant speed on a straight road is in a non-inertial frame of referance.
Reason: A reference frame in which Newton's laws of motion are applicable is non-inertial.
View SolutionA rod with rectangular cross section oscillates about a horizontal axis passing through one of its ends and it behaves like a seconds pendulum, its length will be
View SolutionThe graph shown in figure is exponential. Write down the equation corresponding to the graph.
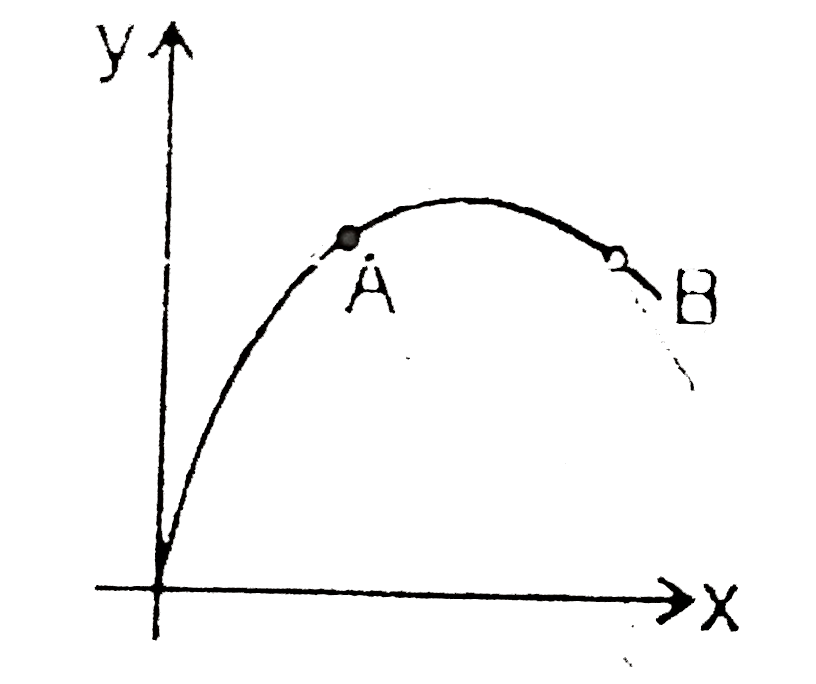
View SolutionFor the shown graph slope of graph from point A to point B :
View SolutionThe |u|,|v| graph for a concave mirror is a shown in figure. Here |u|gt|f| . A line passing through origin of slope 1 cut the graph at point P . Then co-ordinate of point P are
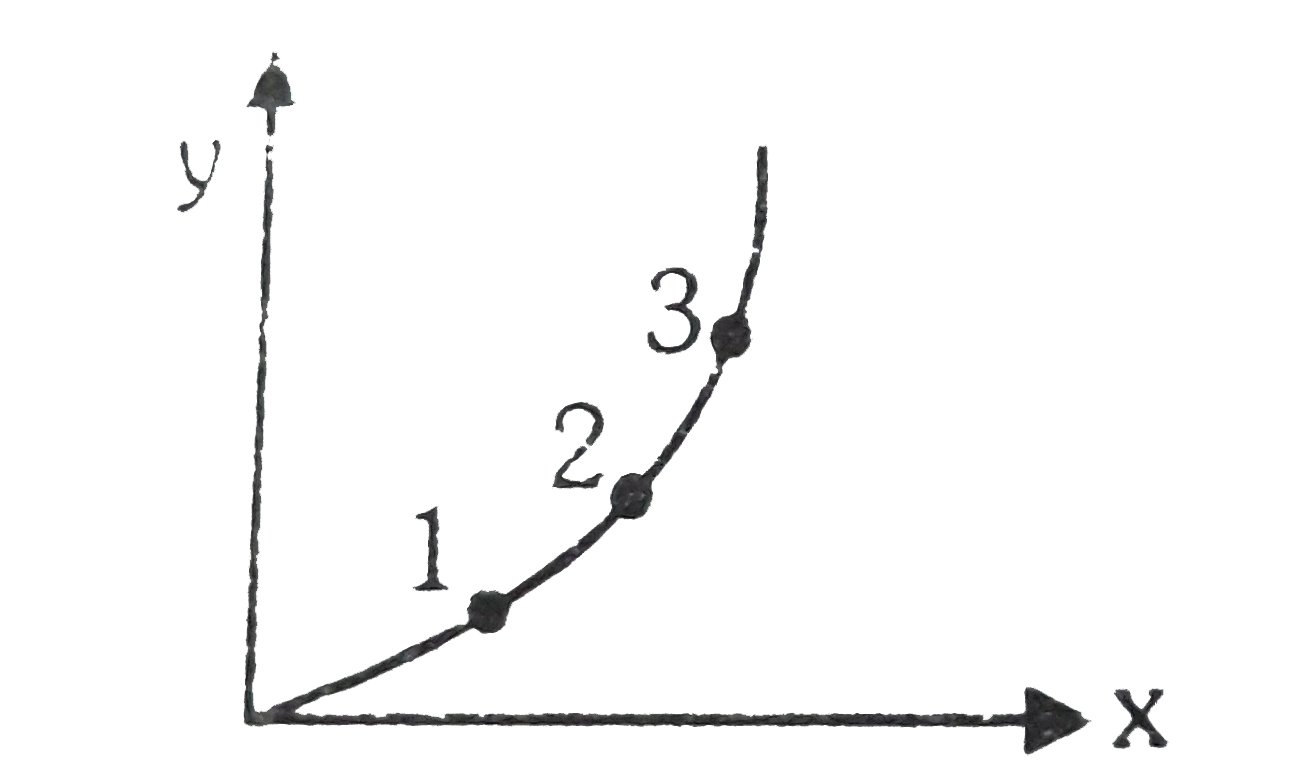
View SolutionThe slope of graph as shown in figure at points 1,2 and 3 is m1,m2 and m3 respectively then
View SolutionMagnitude of slope of the shown graph.
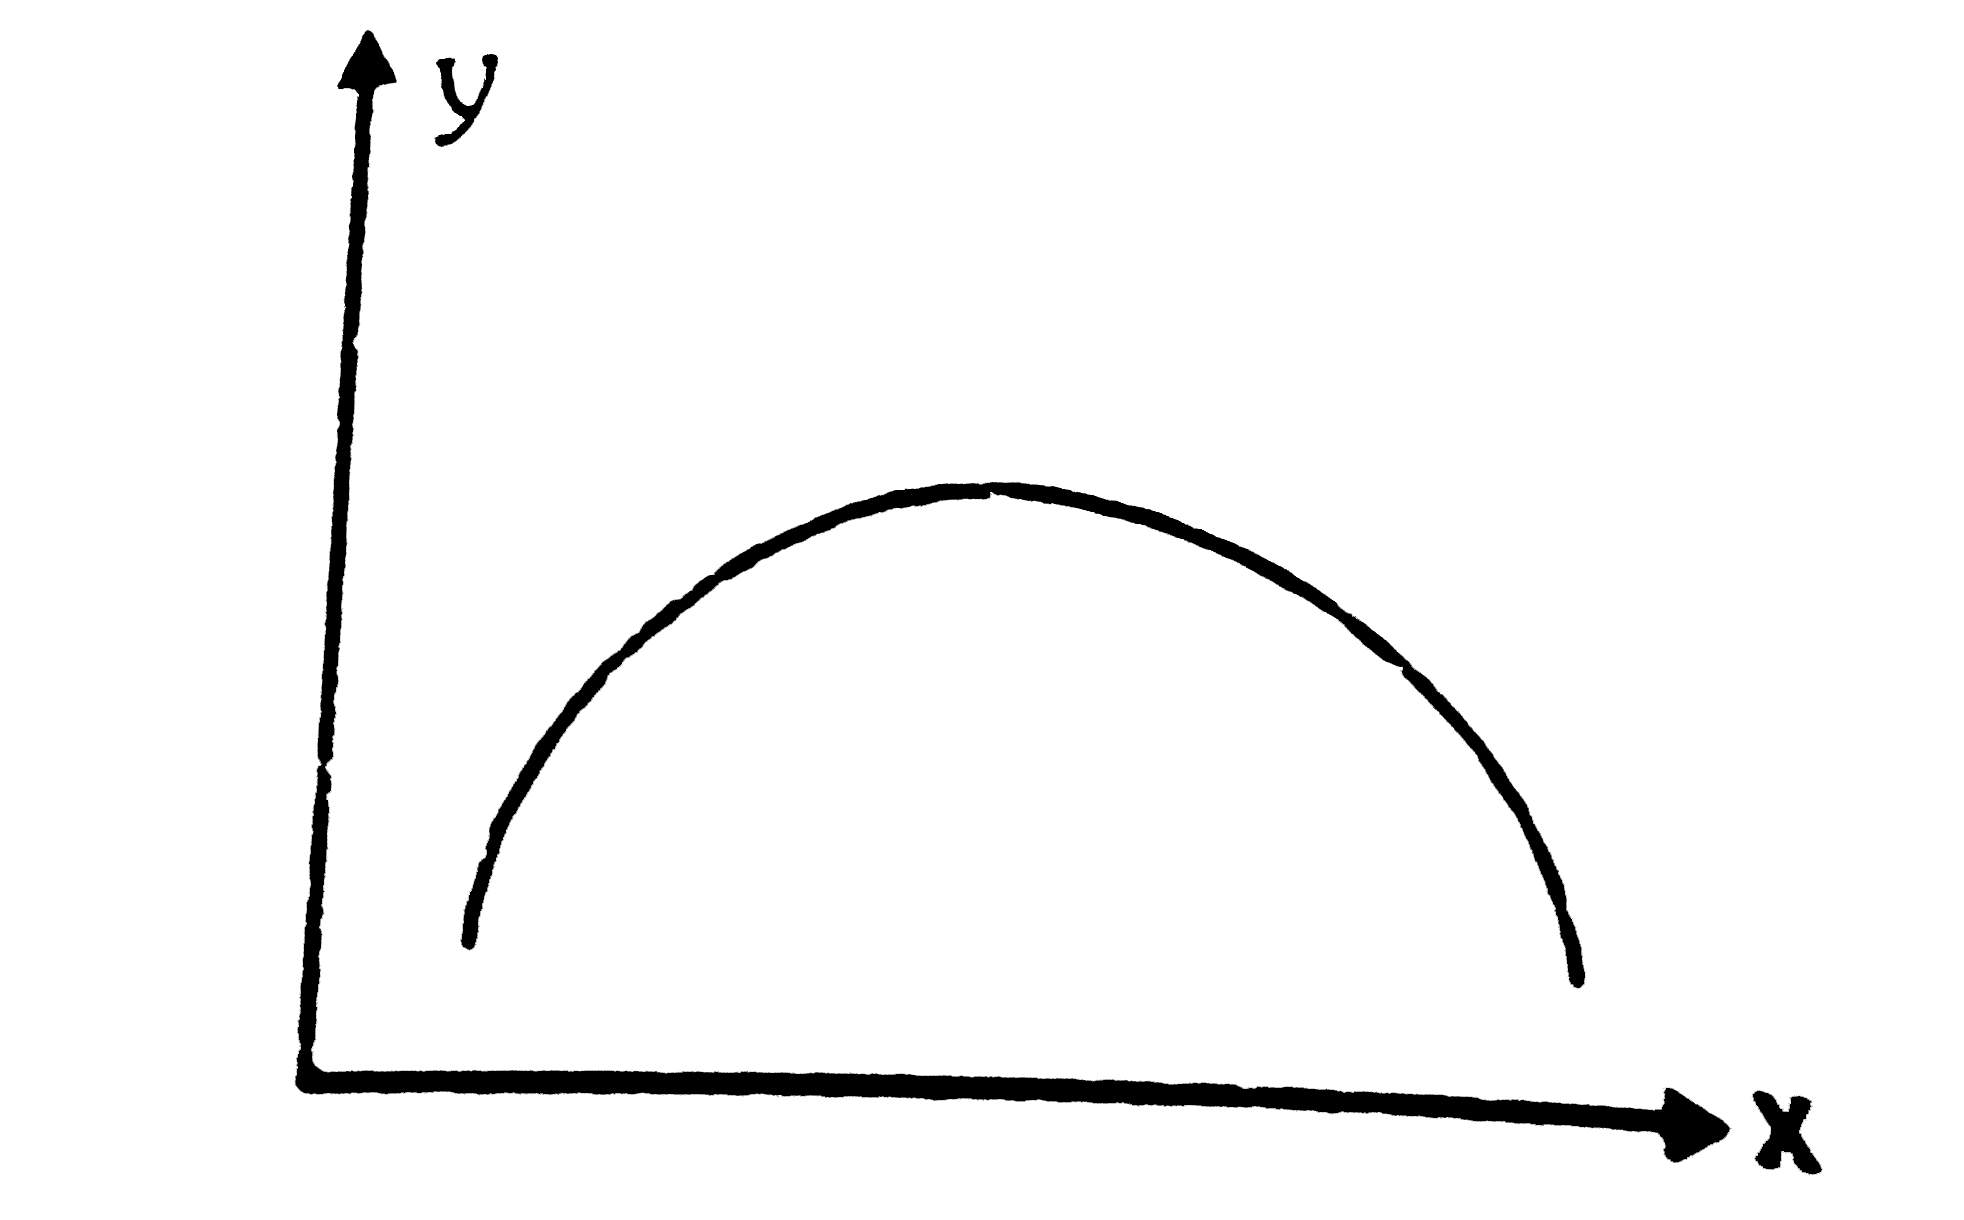
View SolutionThe slope of graph as shown in figure at points 1, 2 and 3 is m_1, m_2 and m_3 respectively then
View Solution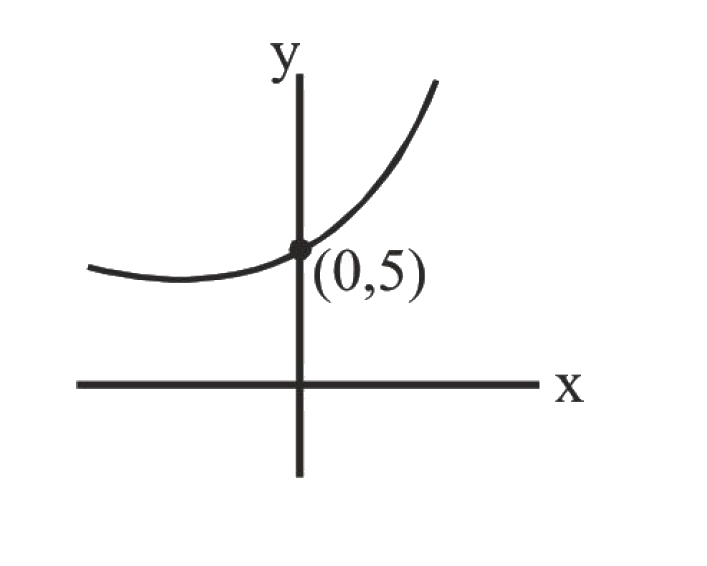
If the equation for graph shown in figure is y=aex then value of a is:-
View SolutionThe graph shown in figure is exponential. Write down the equation corresponding to the graph.
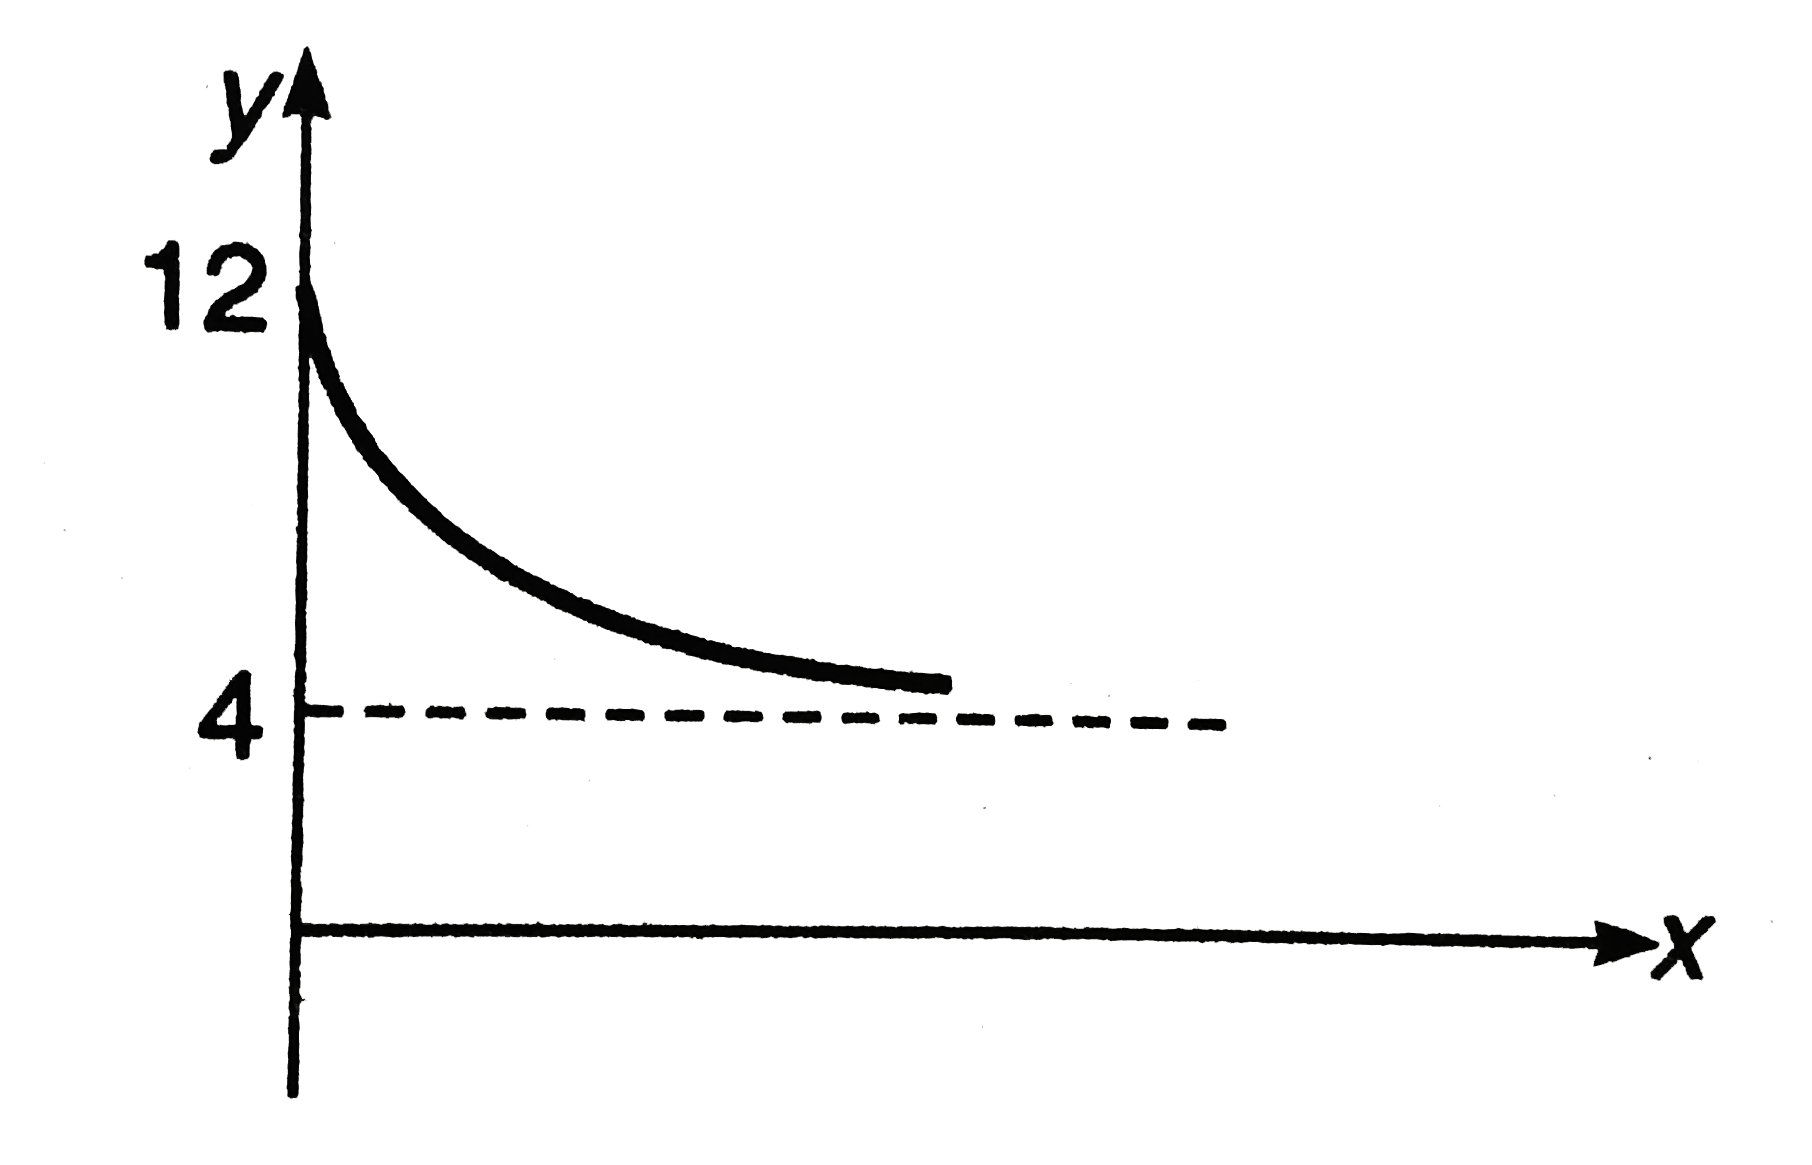
View SolutionThe graph shown in figure is exponential. Write down the equation corresponding to the graph.
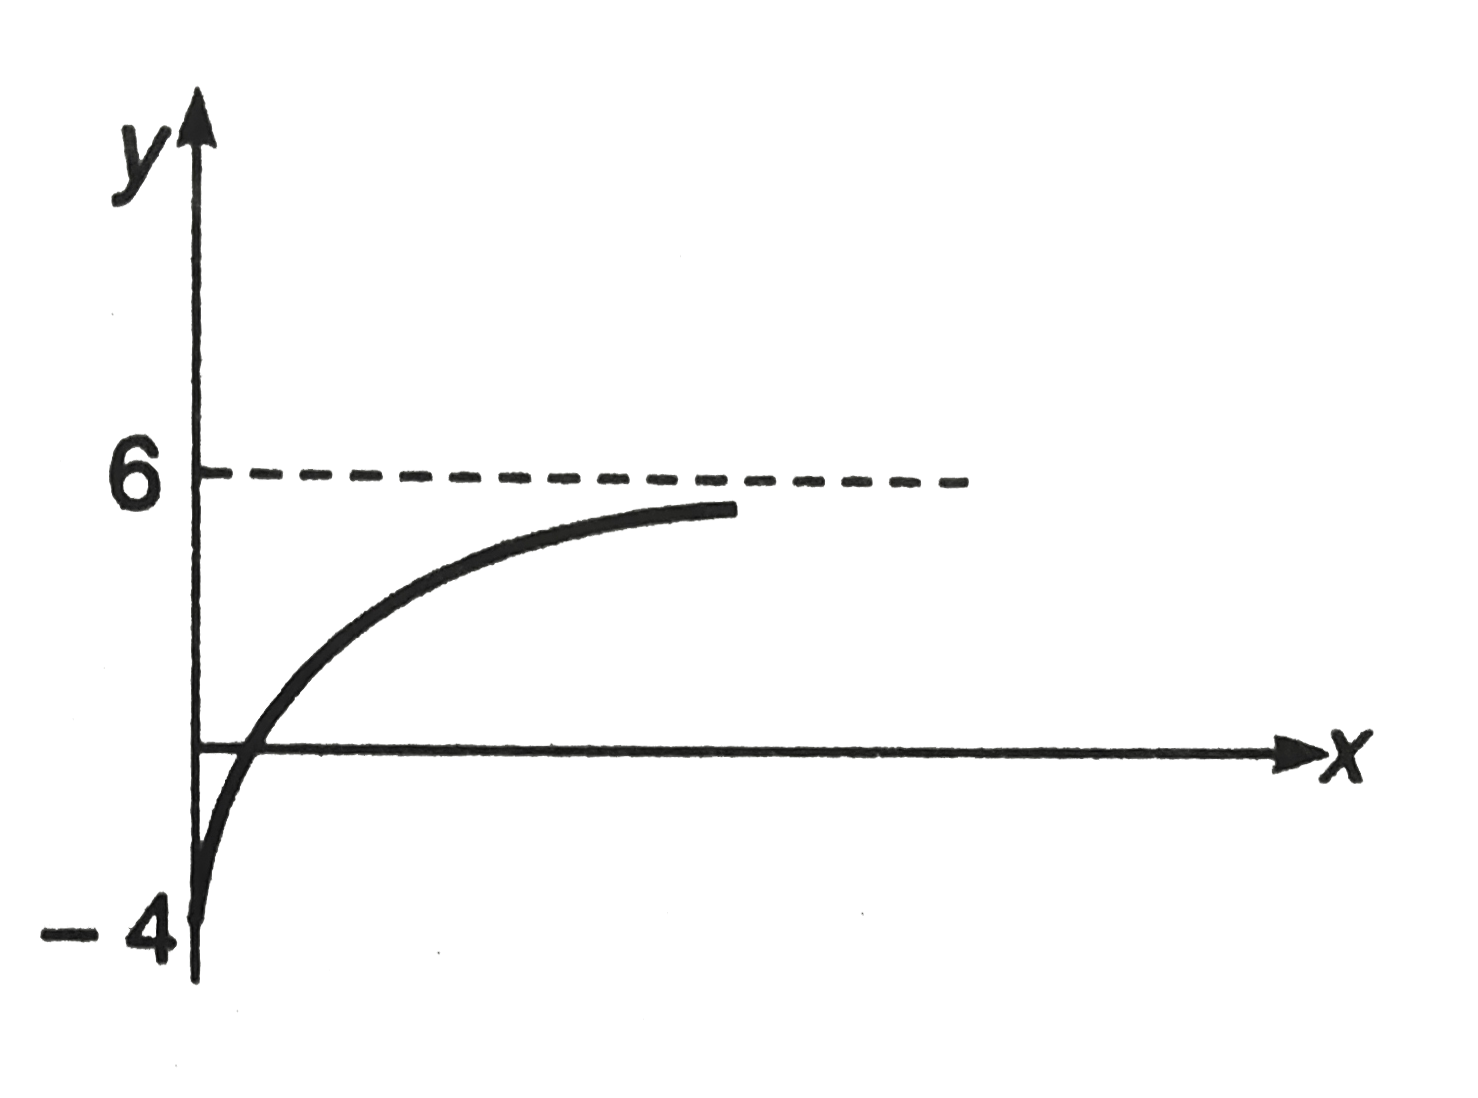
View SolutionThe |u|,|v| graph for a concave mirror is a shown in figure. Here |u|gt|f| . A line passing through origin of slope 1 cut the graph at point P . Then co-ordinate of point P are
View SolutionFor the shown graph slope of graph from point A to point B :
View Solution
