Ina recent report, the gross enrolment ratios at the primary level, that is the number of children enrolled in classes one to five as a proportion of all children aged 6 to 10, were shown to be very high for most stages, in many cased they were may above 100 percent. These figures are not worth anything, since they are based on the official enrolment data compiled from school records. They might as well stand for 'gross exaggeration ratios'.
Which one of the following options best supports the claim that the ratios are exaggerated ?
The definition of gross enrolment ratio does not exclude, in its numerator, children below 6 years or above 10 years enrolled in classes one to five.
A school attendance study found that many children enrolled in the school records were no meeting a minimum attendance requirement of 80 percent.
A study estimated that close to 22 children enrolled in the class one records were below 6 years of age and still to start going to school.
Demographic surveys show shifts in the population profile which indicate that the number of children in the age group 6 to 10 years is declining
The correct Answer is:C
According to the given passage, a study estimated that close to 22 children enrolled in the class one records were below 6 years of age and still to start going to school, thus the ratio is exaggerated.
Topper's Solved these Questions
- CRITICAL REASONINGBOOK - LUCENT PUBLICATIONCHAPTER - CRITICAL REASONINGEXERCISE - EXERCISE-2
62 Videos
- CRITICAL REASONINGBOOK - LUCENT PUBLICATIONCHAPTER - CRITICAL REASONINGEXERCISE - EXERCISE-2
62 Videos
- CONCLUSIONS FROM CODED INEQUALITIES AND SYMBOLS BOOK - LUCENT PUBLICATIONCHAPTER - CONCLUSIONS FROM CODED INEQUALITIES AND SYMBOLS EXERCISE - Exercise-1
58 Videos
- CUBE AND DICE BOOK - LUCENT PUBLICATIONCHAPTER - CUBE AND DICE EXERCISE - Exercise
10 Videos
Similar Questions
Knowledge Check
The table below shows the number of students enrolled in five colleges over the five years
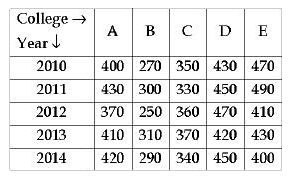
In the year 2014 what percent of students were enrolled in college CA16.9B17.8C16.7D19.1The number of students enrolled in different streams in a college is shown in the following table.

The ratio of the total number of boys to that of girls in the college is:A1:1B23:27C13:12D27:23What is the ratio between the average number of students enrolled with all colleges together in 2007 and 2008, respectively?
A108:113B108:117C110:113D111:113
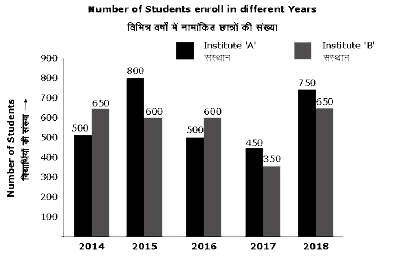
In the given bar graph, the number of students enrolled in institute b in the year 2016 is what percentage of students enrolled in institute A in 2016?
View SolutionChange the statements, converting expressions into statements in ordinary language:
The number of girls enrolled in a school last years was g. the number of girls enrolled this years in the school is 3g-10.
View Solution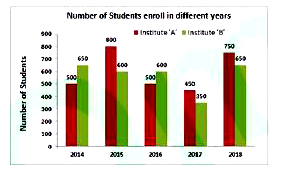
In the given bar graph, the number of students enrolled in institute B in the year 2016 is what percentage of students enrolled in institute A in 2016?
View SolutionThe given bar graph presents the number of students enrolled for a vocational course in institutes A and B during a period of five years.
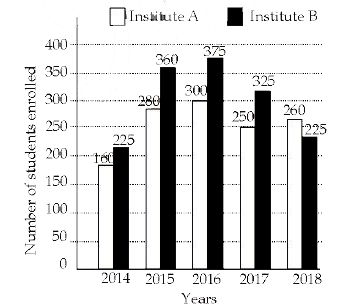
percentage the number of students enrolled in B more than the number of students enrolled in A during 2017?
View SolutionThe pie chart shows the number of students enrolled in the various engineering courses that a certain college offers. Study the diagram and answer the following questions.
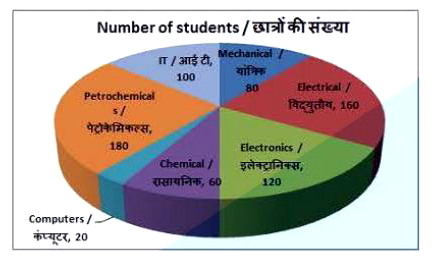
The most number of students are enrolled in which course?
View Solution

