The graph between displacement and time in a motion along straight line is depicted below. Which interval indicates that no force is acting on the particle?

RS
QR
PQ
OP
The correct Answer is:C
PQ is a horizontal line parallel to time axis. So, velocity is zero, hence acceleration and therefore force is zero.
Similar Questions
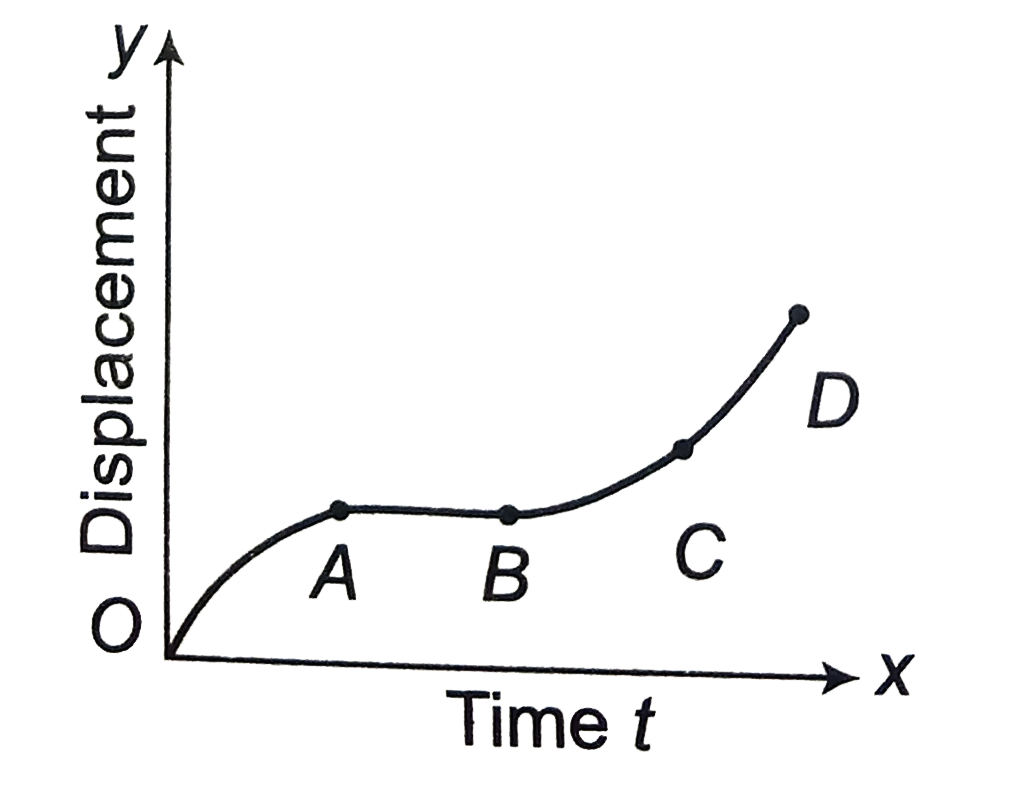
The graph between the displacement x and time t for a particle moving in a straight line is shown in the figure. During the interval OA,AB,BC and CD the acceleration of the particle is
OA,AB,BC,CD
View SolutionDisplacement time graph of a particle moving in a straight line is a shown in figure.

View Solution
Knowledge Check
The graph between the displacement x and time t for a particle moving in a straight line is shown in the figure. During the interval OA,AB,BC and CD the acceleration of the particle is
OA,AB,BC,CD
 A+,0,+,+B−,0,+,0C+,0,−,+D−,0,−,0
Displacement time graph of a particle moving in a straight line is a shown in figure.
 Ain region A acceleration is positiveBin region B acceleration is negativeCin region C acceleration is positiveDin region D acceleration is negative
The graph of displacement vs time for a particle moving along a straight line is as shown. The best option for the corresponding velocity - time graph will be:
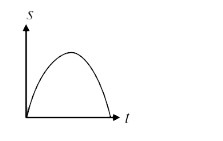 A
A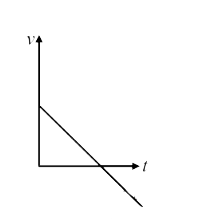 B
B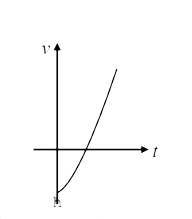 C
C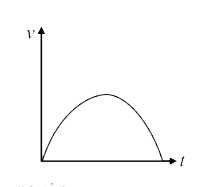 D
D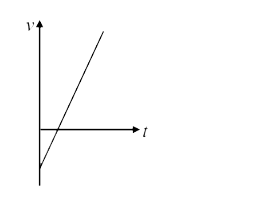
The graph of displacement vs time for a particle moving along a straight line is as shown. The best option for the corresponding velocity - time graph will be:

View SolutionThe velocity-time graph of a particle moving in a straight line is shown in figure. The mass of the particle is 2kg. Work done by all the forces acting on the particle in time interval between t=0 to t=10s is
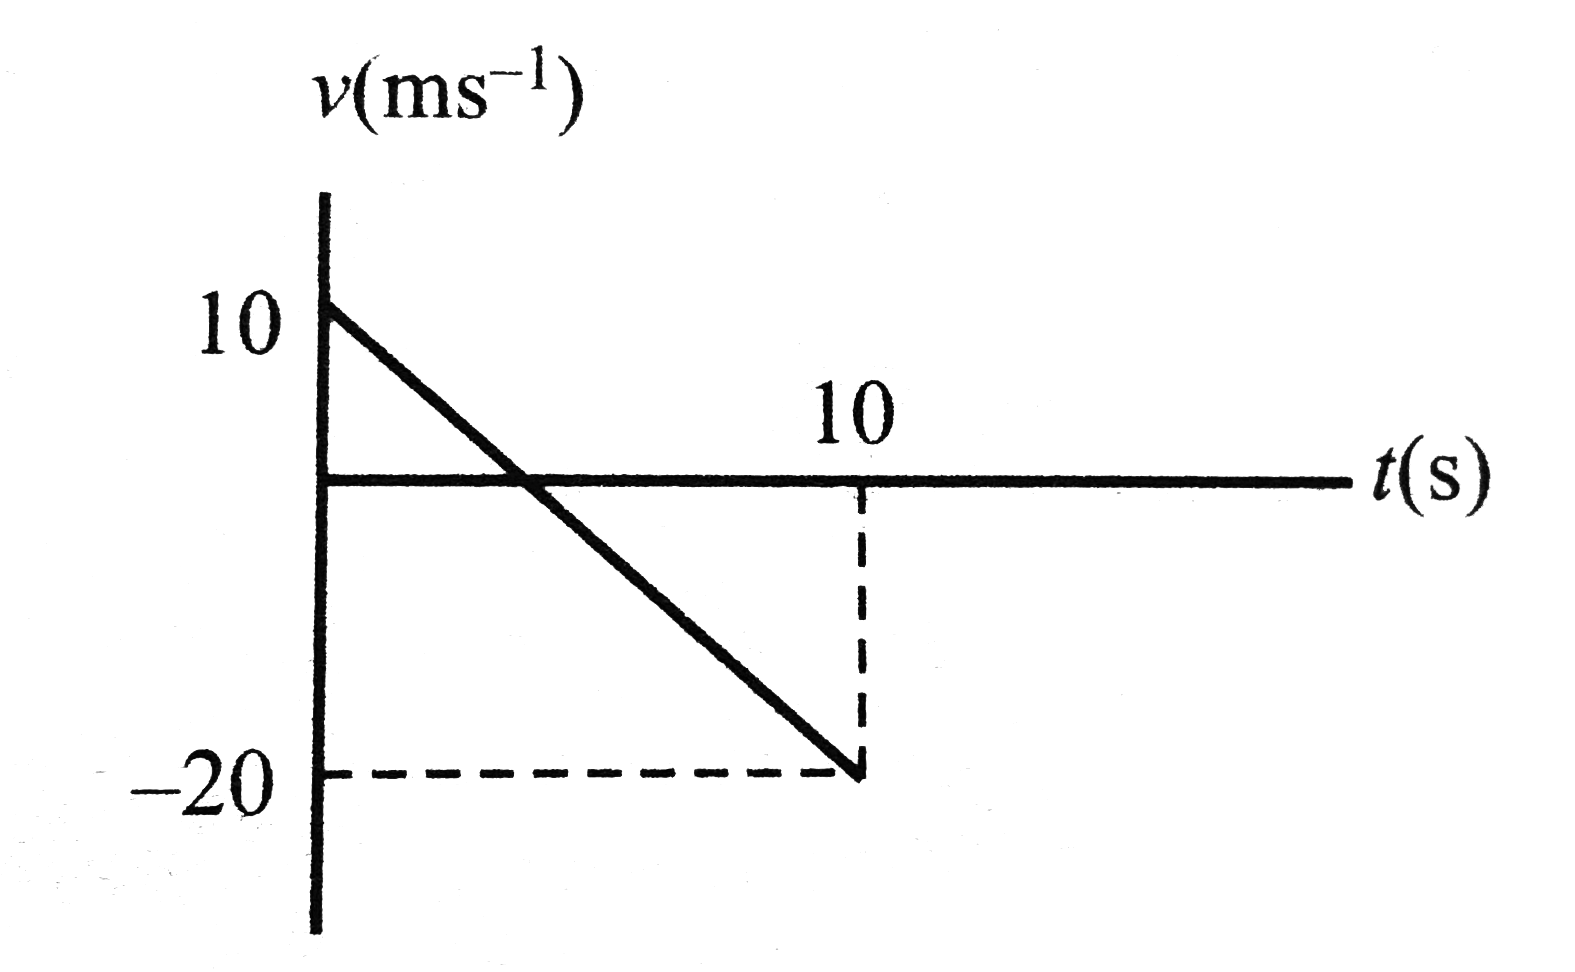
View SolutionThe velocity-time graph of a particle moving in a straight line is shown in figure. The mass of the particle is 2kg. Work done by all the forces acting on the particle in time interval between t=0 to t=10s is

View SolutionVelocity-time graph of a particle moving in a straight line is shown in the figure. Mass of the particle is 2 kg. Work done by all the forces acting on the particle in time interval t = 0 to t = 10 sec is
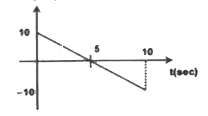
View SolutionThe velocity-time graph of a particle moving along a straight line is given as below. The displacement time curve for the particle is given by :
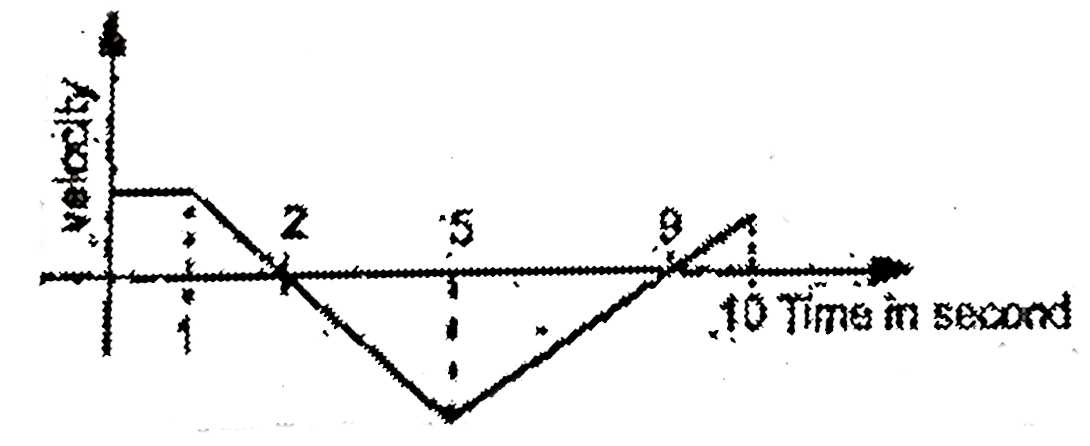
View Solution
