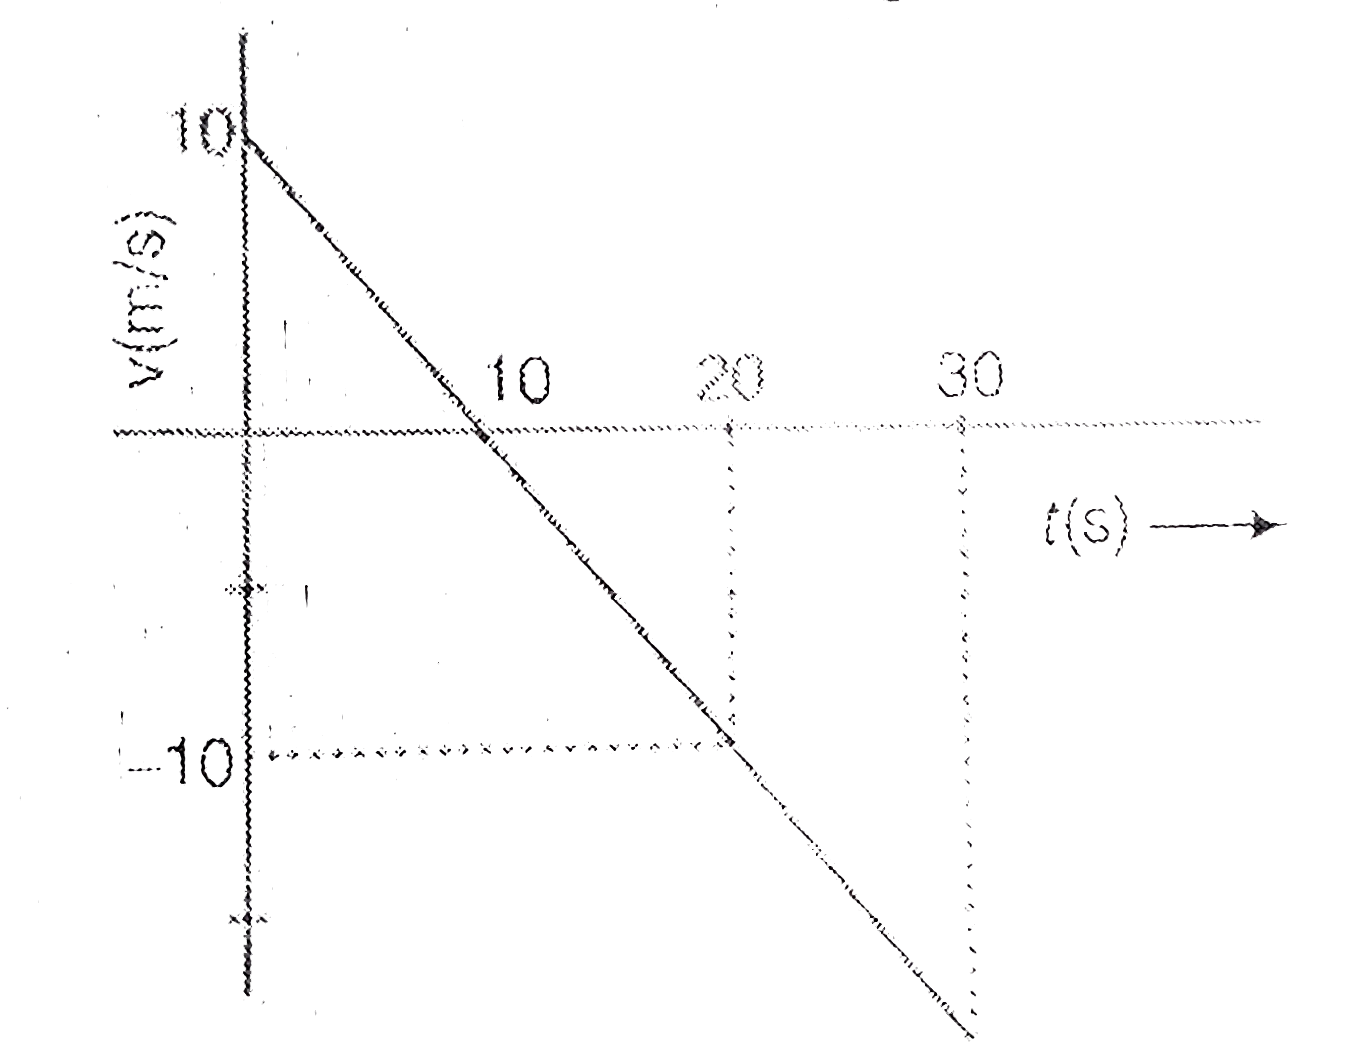
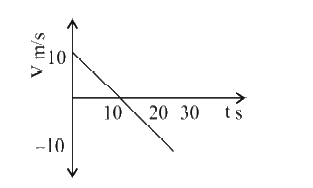
Velocity time graph for the motion of a particle along a straight line is as shown in figure.
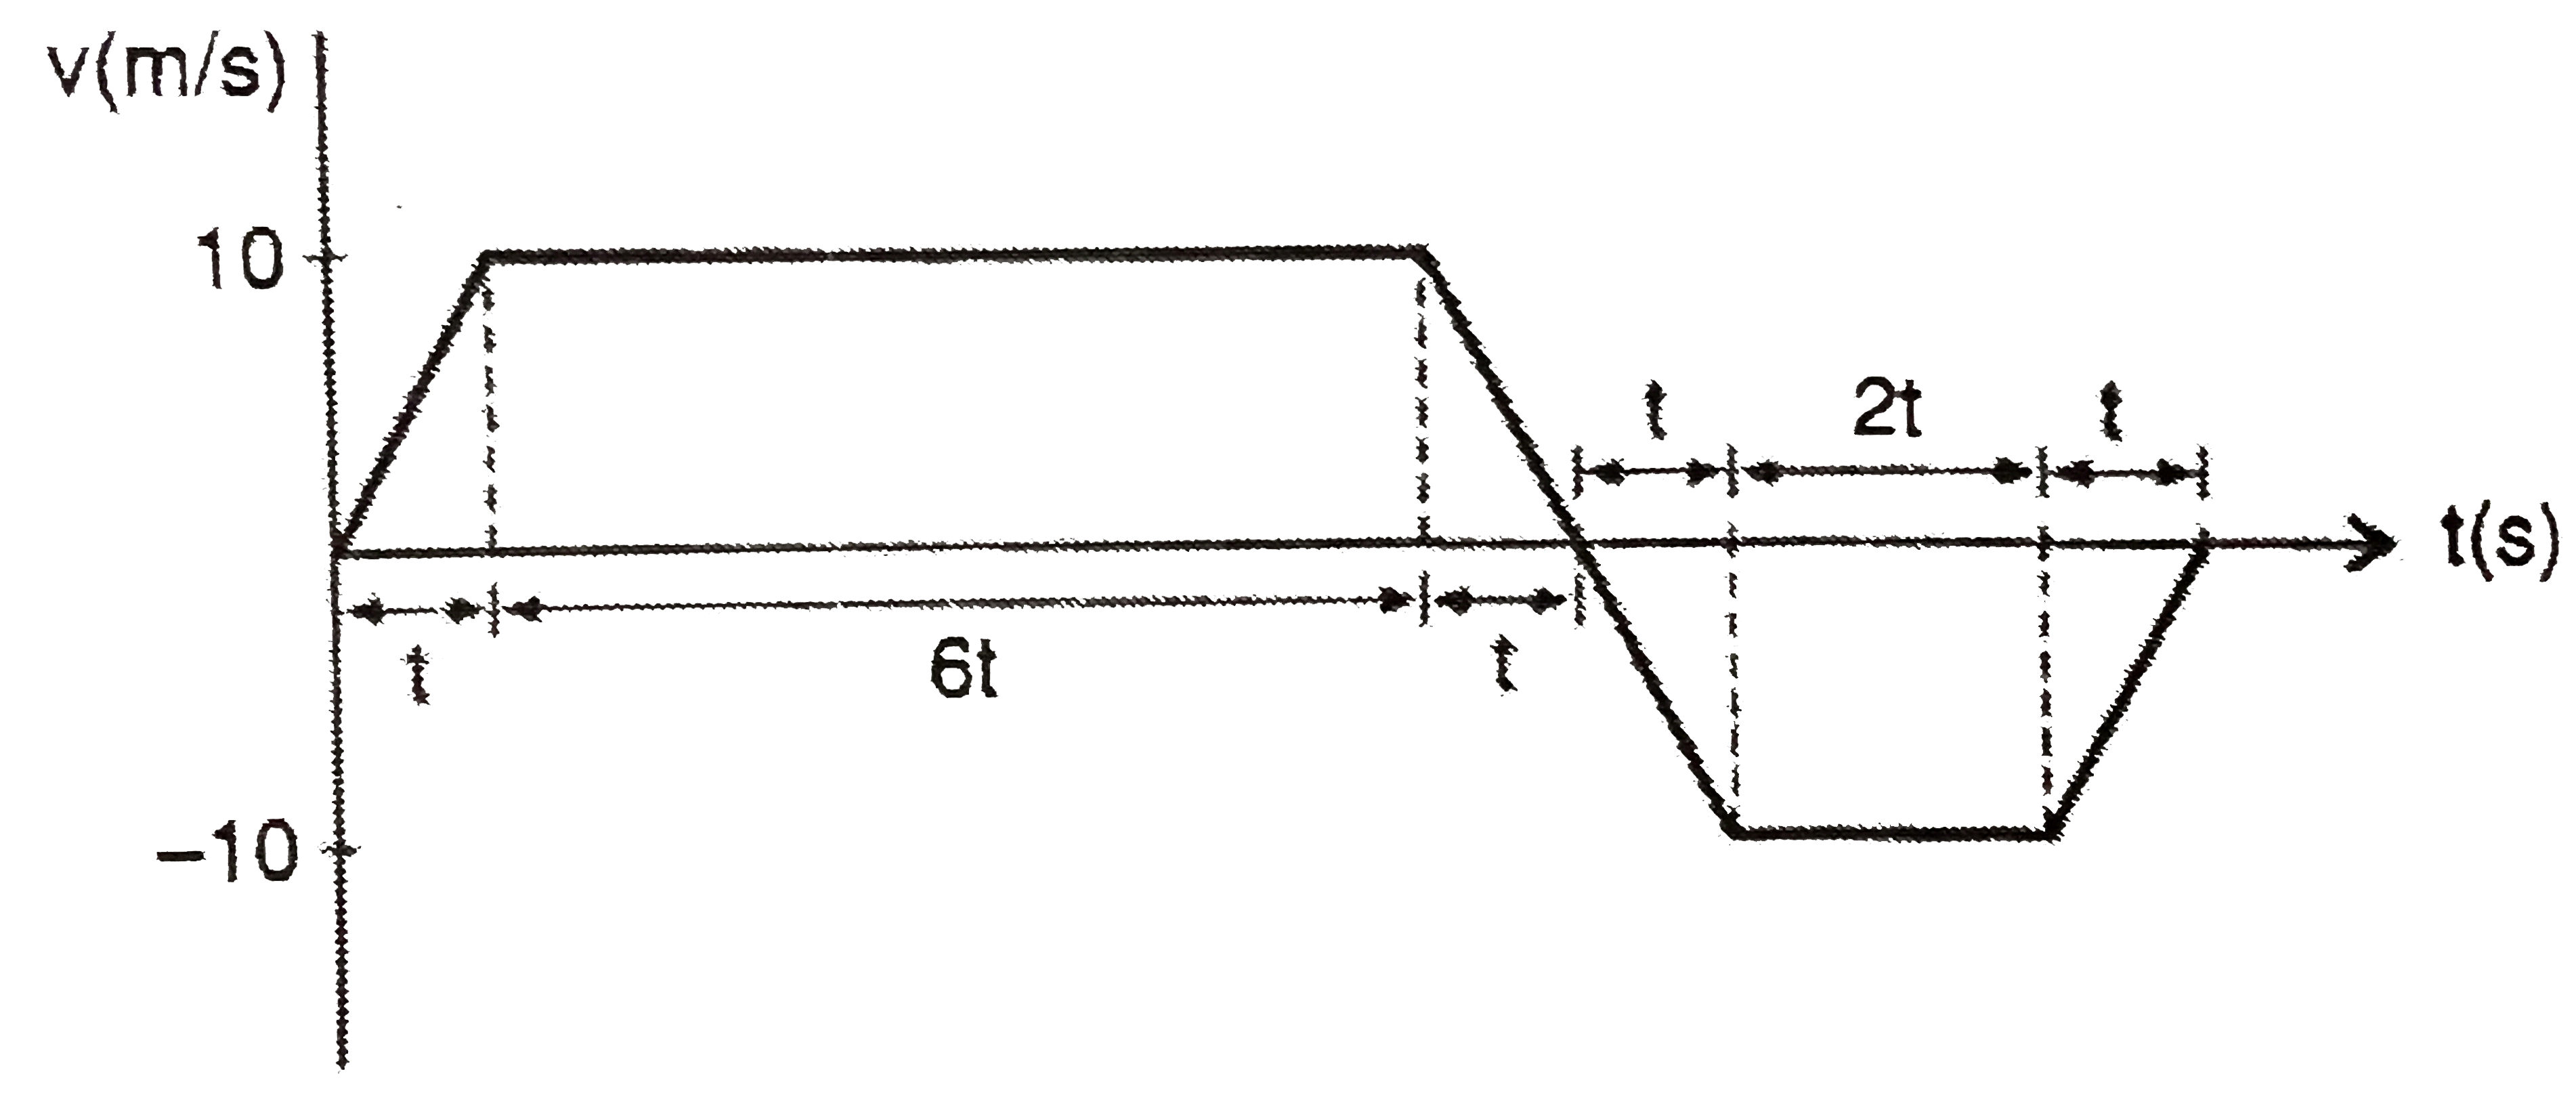
Average speed of the particle for the whole motion is:
9.6 m/s
7.2 m/s
8.3 m/s
6.5 m/s
The correct Answer is:C
d= Total area under the curve
=12(6t+8t)×10+12(2t+4t)×10
=70t+30t
=100t
vav=Total distanceTotal time=100t12t=8.3m/s
Topper's Solved these Questions
- BOOK - GRB PUBLICATIONCHAPTER - MOTION IN A STRAIGHT LINEEXERCISE - More than one choice is correct16videos
MOTION IN A STRAIGHT LINE
- BOOK - GRB PUBLICATIONCHAPTER - MOTION IN A STRAIGHT LINEEXERCISE - Assertion Reason12videos
MOTION IN A STRAIGHT LINE
- BOOK - GRB PUBLICATIONCHAPTER - MOTION IN A STRAIGHT LINEEXERCISE - Problems and Practice16videos
MOTION IN A STRAIGHT LINE
- BOOK - GRB PUBLICATIONCHAPTER - FRICTION AND CIRCULAR MOTION EXERCISE - Comprehension type11videos
FRICTION AND CIRCULAR MOTION
- BOOK - GRB PUBLICATIONCHAPTER - MOTION IN TWO AND THREE DIMENSIONSEXERCISE - All Questions210videos
MOTION IN TWO AND THREE DIMENSIONS
Similar Questions
Knowledge Check
- Question 1 - Select One or More
Velocity displacement graph of a particle moving in a straight line is as shown in figure.
 Amagnitude of acceleration of particle is decreasingBmagnitude of acceleration of particlre is increasingCacceleration versus displacement graph straight lineDacceleration versus displacement graph is parabola
 - Question 2 - Select One
Average velocity of the particle for the motion
A3.3 m/sB6.7 m/sC2.7 m/sD7.6 m/s - Question 3 - Select One or More
Displacement time graph of a particle moving in a straight line is a shown in figure.
 Ain region A acceleration is positiveBin region B acceleration is negativeCin region C acceleration is positiveDin region D acceleration is negative
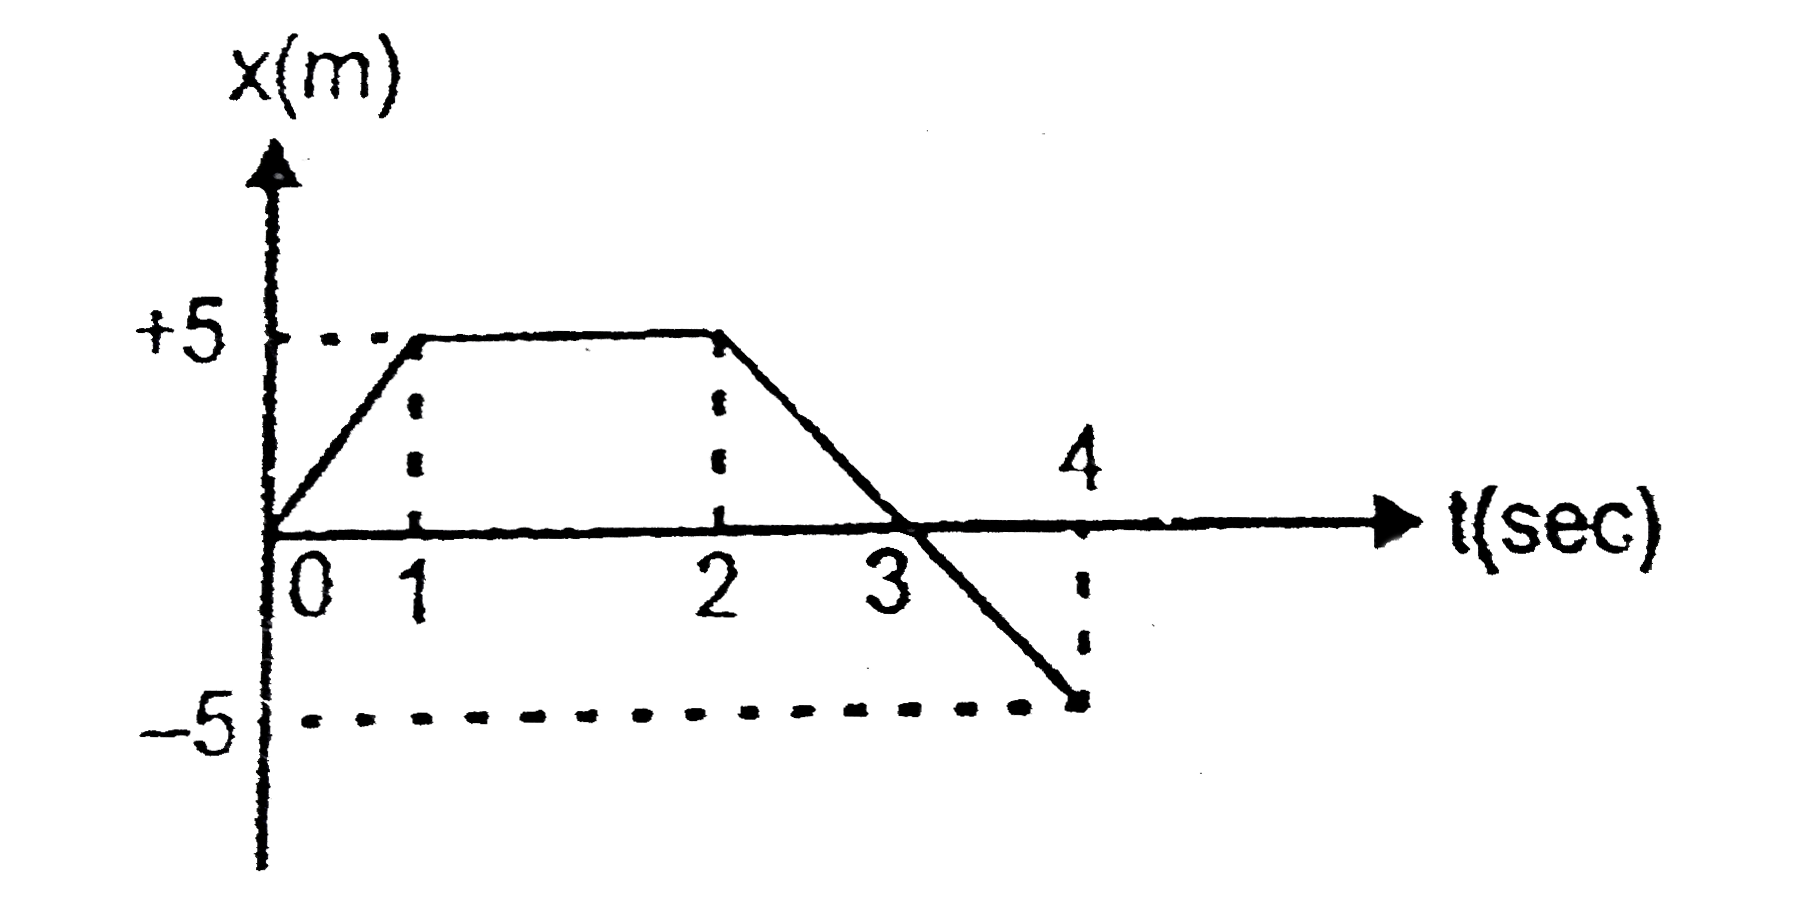
Position-time graph for a particle moving along x− direction is as shown in the figure. Average speed of the particle from t=0 to t=4 is :
 View Solution
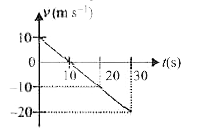
The velocity-time plot for a particle moving on a straight line is shown in figure.
 View Solution
The velocity - time graph of a particle moving along a straight line is shown in the figure given below
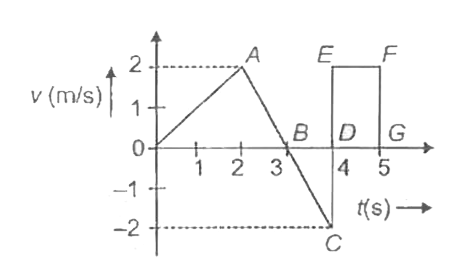
The displacement of the particle in 5 second isView SolutionThe x-t graph of a particle moving along a straight line is shown in figure
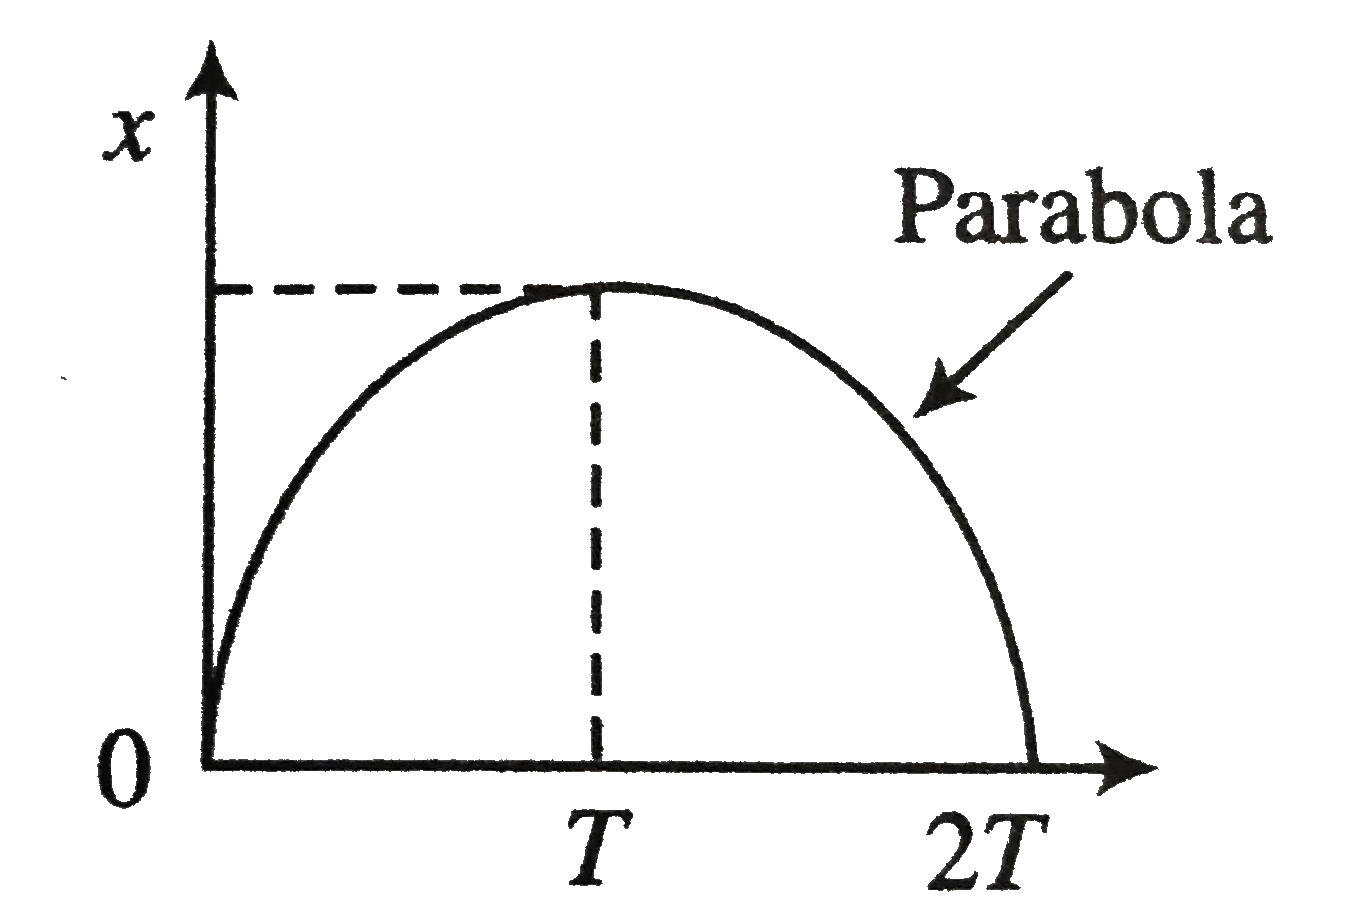
The a-t graph of the particle is correctly shown byView SolutionThe x-t graph of a particle moving along a straight line is shown in figure

The v-t graph of the particle is correctly shown byView Solution


