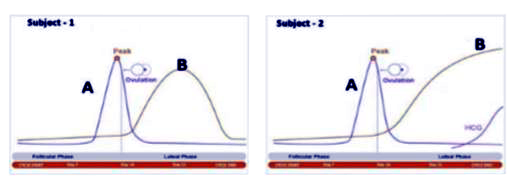
To answer the questions, study the graphs below for Subject 1 and 2 showing differentlevels of certain hormones.
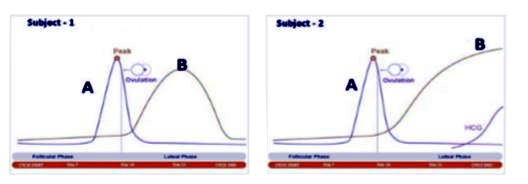
If the peak of Hormone A does not appear in the study for Subject 1, which of thefollowing statement is true?
Peak of Hormone B will be observed at a higher point in the graph
Peak of Hormone B will be observed at a point lower than what is given in the graph
There will be no observed data for Hormone B
The graph for Hormone B will be a sharp rise followed by a plateau
The correct Answer is:C
The presence of peak of hormone A is essential for occurrence of normal data of hormone B.
Topper's Solved these Questions
- BOOK - EDUCART PUBLICATIONCHAPTER - SAMPLE PAPER 1 EXERCISE - SECTION-B24videos
SAMPLE PAPER 1
- BOOK - EDUCART PUBLICATIONCHAPTER - SAMPLE PAPER (SELF-ASSESSMENT)-11EXERCISE - SECTION -C1videos
SAMPLE PAPER (SELF-ASSESSMENT)-11
- BOOK - EDUCART PUBLICATIONCHAPTER - SAMPLE PAPER 10EXERCISE - SECTION-C10videos
SAMPLE PAPER 10
Similar Questions
To answer the questions, study the graphs below for Subject 1 and 2 showing differentlevels of certain hormones.
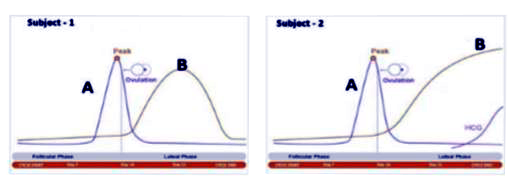
The peak observed in Subject 1 and 2 is due toView SolutionTo answer the questions, study the graphs below for Subject 1 and 2 showing differentlevels of certain hormones.
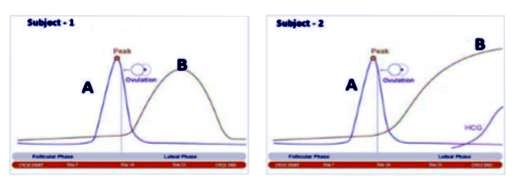
Subject 2 has higher level of hormone B, which isView Solution
Knowledge Check
- Question 1 - Select One
Study the graph carefully and answer the following questions.
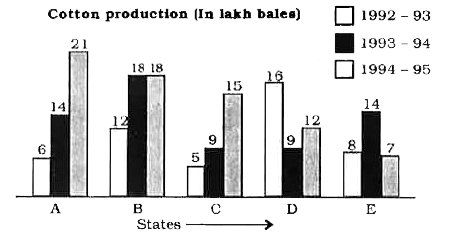
Which of the following statement is false ?AState A and E showed the same production in 1993-94.BThere was no improvement in the production of cotton in state B during 1994-95.CState A has produced maximum cotton during the given period.DProduction of state C and D together is equal to that of state B dring 1993-94. - Question 2 - Select One
A graph between vapour pressure and temperature of few liquids is given below. Study the graph and answer following question.
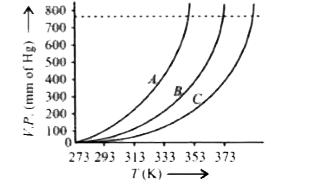
Which of the following statements is not true?ABoiling point of a liquid is the temperature at which its vapour pressure becomes equal to atmospheric pressure.BBoiling point of water can be increased by increased the pressure above the atmospheric pressureCIf liquid B is heated in a closed vessel it will boil at 353 KDLiquid C has higher boilingk point than B due to higher intermolecular forces. - Question 3 - Select One
Study the table and answer the questions:
The table given below shows the highest and average marks of a class in four subjects in four years. The maximum marks in each subject are 100.
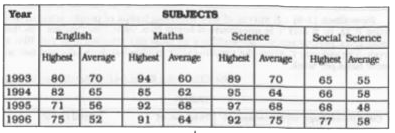
In which year, the difference between the highest and average marks in Social Science was the least ?A1996B1995C1994D1993
To answer the questions, study the graphs below for Subject 1 and 2 showing differentlevels of certain hormones.
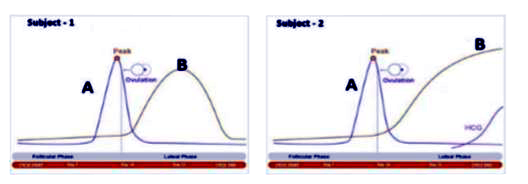
Which of the following statements is true about the subjects?View SolutionTo answer the questions, study the graphs below for Subject 1 and 2 showing differentlevels of certain hormones.
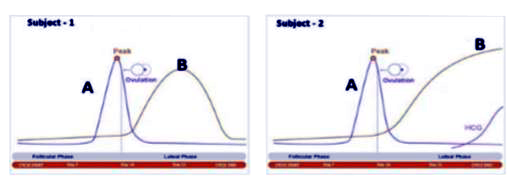
Which structure in the ovary will remain functional in subject 2?View SolutionTo answer the questions, study the graphs below for Subject 1 and 2 showing differentlevels of certain hormones.
For subject 2 it is observed that the peak for hormone B has reached the plateau stage.After approximately how much time will the curve for hormone B descend?View SolutionA biology student after studying about the different levels of hormones during the menstrual cycle was comparing 2 subjects (Patients). A table was created after looking at the levels of hormones A and B for Subject 1 and 2. Read the information in the table and answer the questions that follow

If the peak of Hormone A does not appear in the study for Subject 1, which of the following statement is trueView SolutionA biology student after studying about the different levels of hormones during the menstrual cycle was comparing 2 subjects (Patients). A table was created after looking at the levels of hormones A and B for Subject 1 and 2. Read the information in the table and answer the questions that follow

Which of the following statements is true about the subjects?View Solution

