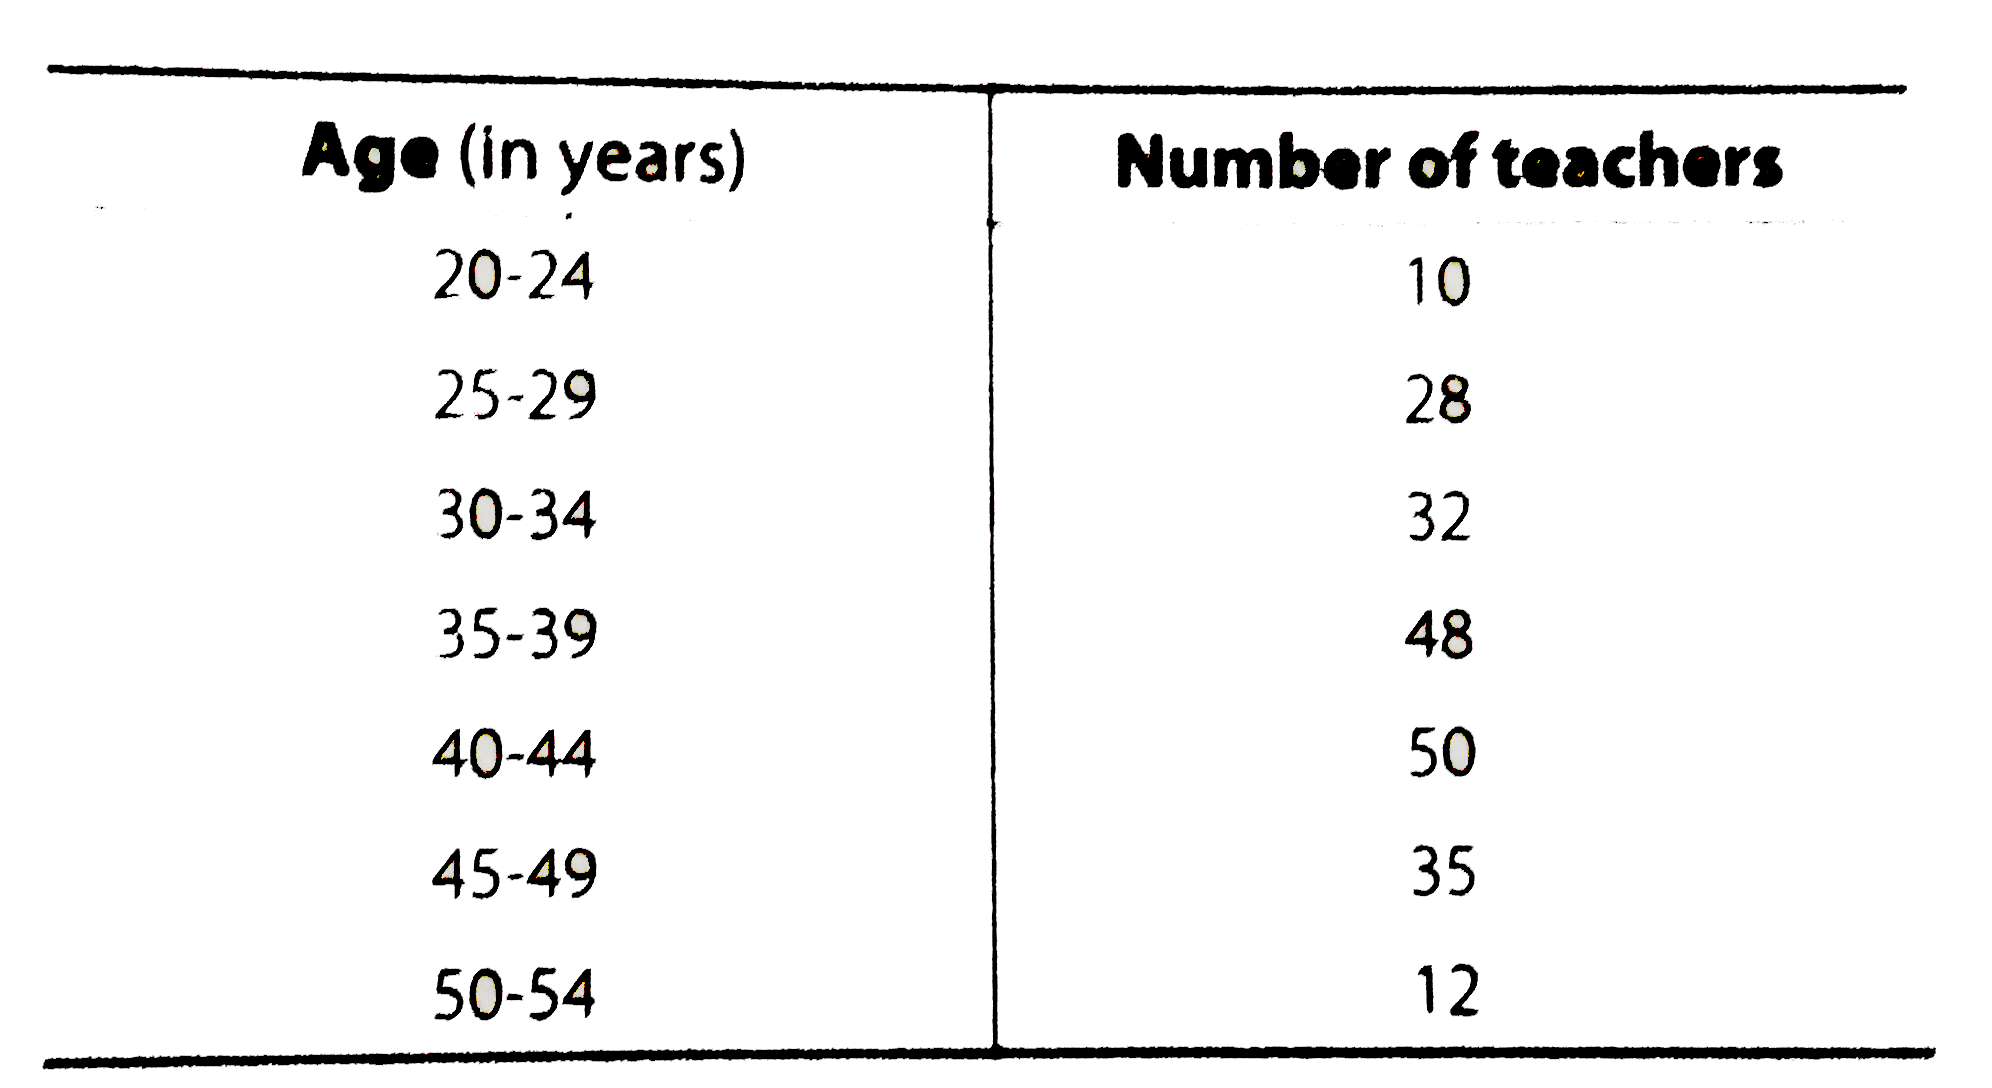
Histogram is used to represent
A
Non-continuous grouped frequency distribution
B
Ungrouped frequency distribution
C
Continuous grouped frequency distribution
D
All of the these
Text Solution
The correct Answer is:C
|
Similar Questions
Knowledge Check
Histogram is a
AOne dimensional figure,BTwo dimensional figureCMultidimensional figureDThree dimensional figure.
Draw a histogram to represent the following:

View SolutionDraw a histogram to represent the following :

View SolutionDraw a histogram to represent the following:

Also draw a frequency polygon with the help of histogram
View SolutionDraw a histogram to represent the following data.

View SolutionDraw the histogram to represent the following data.

View SolutionDraw a histogram to represent the following grouped frequency distribution.

View SolutionThe histogram below represents the scores obtained by 25 students in a Mathematics mental test. Use the data to,
(i) Frame a frequency distribution table
(ii) To calculate mean
View Solution

