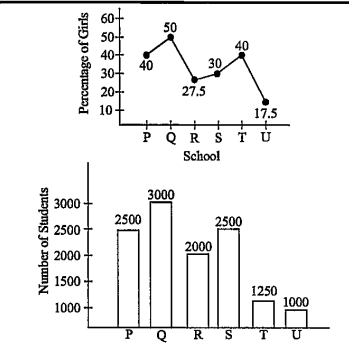
The average number of student in both School P and Q.
1425
1575
1450
2750
The correct Answer is:D
Similar Questions
The following pie-chart shows the percentage-wise distribution of the number of students in five different schools P, Q, R, S and T. The total number of students in all five schools together is 8400.

Find the average number of students in schools R and S together.
View SolutionThe following pie chart shows the percentage-wise distribution of the number of students in five different schools P, Q, R, S and T. The total number of students in all five schools together is 8400.
निम्नलिखित पाई चार्ट पांच अलग-अलग स्कूलों P, Q, R, S और T में छात्रों की संख्या के प्रतिशत को दर्शाता है। सभी पाँच स्कूलों में कुल छात्रों की संख्या 8400 है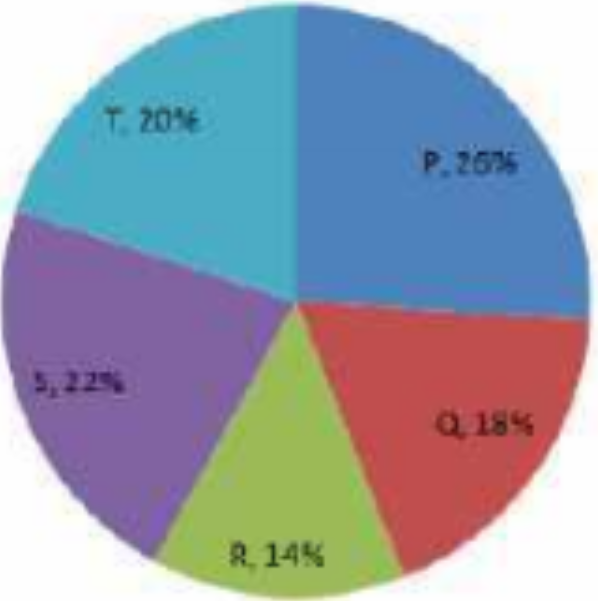 Find the average number of students in schools R and S together.
स्कूलों R और S में एक साथ छात्रों की औसत संख्या ज्ञात कीजिए।
View Solution
Knowledge Check
Study the given pie chart and answer the question that follows.
Break-up of the students studying in schools A,B,C,D and E managed by a society, in 2019
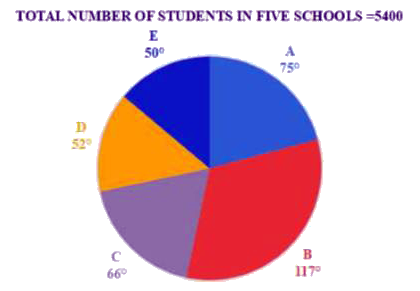
The average number of students in schools A,B and C is what percentage more than the number of students in school E ?A65%B60%C72%D70%What is the average number of students from school B during the six year period
A656.7B616.67C664.37D660.17Study the following graph carefully and answer the questions that follow
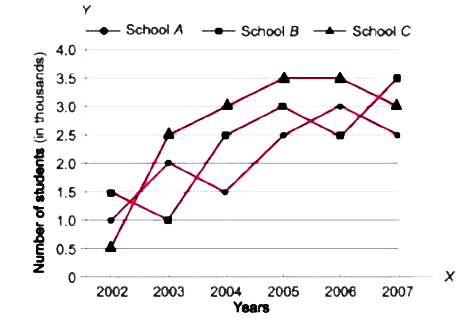
What was the average number of students in all schools together in the year 2006 ?A30000B9000C3000D6000
Direction: There are 1250 total students in 5 different classes in a school. The number of students in class I is 50 less than the number of students in class II. The number of class IV students is 50 more than the number of students in class II. The average number of students in class III and class V is 250. The number of students in class III is 10% less than the number of students in class I.
The average number of students of class II and class III is
View SolutionWhat is the difference between the average number of students appeared in the scholarship exam from all the given schools and the average number of students qualified from all the schools together? (a) 950 (b) 1100 (c) 990 (d) 1020 (e) None of these
View SolutionStudy the following graph carefully to answer the questions.
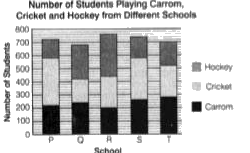
If the number of students playing each game in school S in increased by 15% and the number of students playing each game in school Q is decreased by 5% then what will be the difference between number of students in school S and Q?
View SolutionThe table given below shows the number of students who have taken admission in school A and B from the years 2010 to 2015.
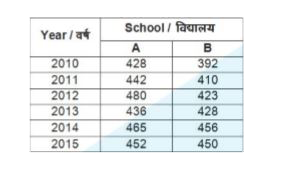
What is the average difference of number of students in school A and B in the given period?
View SolutionThe table given below shows the number of students who have taken admission in school A and B from the years 2010 to 2015.
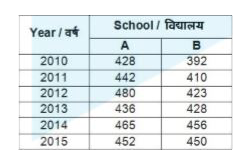
Across all the years, for how many years, the number of students in school A was less than the average number of students in school B?
View Solution
