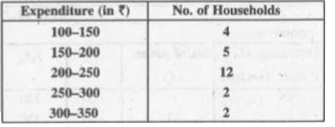
The table below shows the daily expenditure on food of 25 households in a locality. Find the mean daily expenditure on food by a suitable method.
Step by step video & image solution for The table below shows the daily expenditure on food of 25 households in a locality. Find the mean daily expenditure on food by a suitable method. by Maths experts to help you in doubts & scoring excellent marks in Class 10 exams.
Updated on:21/07/2023Topper's Solved these Questions
- STATISTICSBOOK - OSWAL PUBLICATIONCHAPTER - STATISTICSEXERCISE - Multiple Choice Questions
60 Videos
- STATISTICSBOOK - OSWAL PUBLICATIONCHAPTER - STATISTICSEXERCISE - Very Short Answer Type Questions
4 Videos
- STATISTICSBOOK - OSWAL PUBLICATIONCHAPTER - STATISTICSEXERCISE - BOARD CORNER (Short answer type questions)
5 Videos
- SOME APPLICATIONS OF TRIGONOMETRY (HEIGHTS AND DISTANCES) BOOK - OSWAL PUBLICATIONCHAPTER - SOME APPLICATIONS OF TRIGONOMETRY (HEIGHTS AND DISTANCES) EXERCISE - CASE-BASED MCQs
15 Videos
- SURFACE AREAS AND VOLUMES BOOK - OSWAL PUBLICATIONCHAPTER - SURFACE AREAS AND VOLUMES EXERCISE - BOARD CORNER (LONG ANSWER TYPE QUESTIONS)
9 Videos
Similar Questions
The table below shows daily expenditure on food of 25 households in a locality.
Find the mean daily expenditure.
View SolutionThe table below shows the daily expenditure on food of 30 households in a locality:

Find the mean and median daily expenditure on food.
View SolutionThe table below shows the daily expenditure on food of 25 households in a locality.
Dail expenditure (in Rs)100−150150−200200−250250−300300−350Number of households451222
Find the mean daily expenditure on food by suitable method.
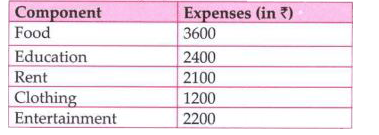
View SolutionThe table given below shows the expenditures on different component of a person. What was the total expenditure of the person?
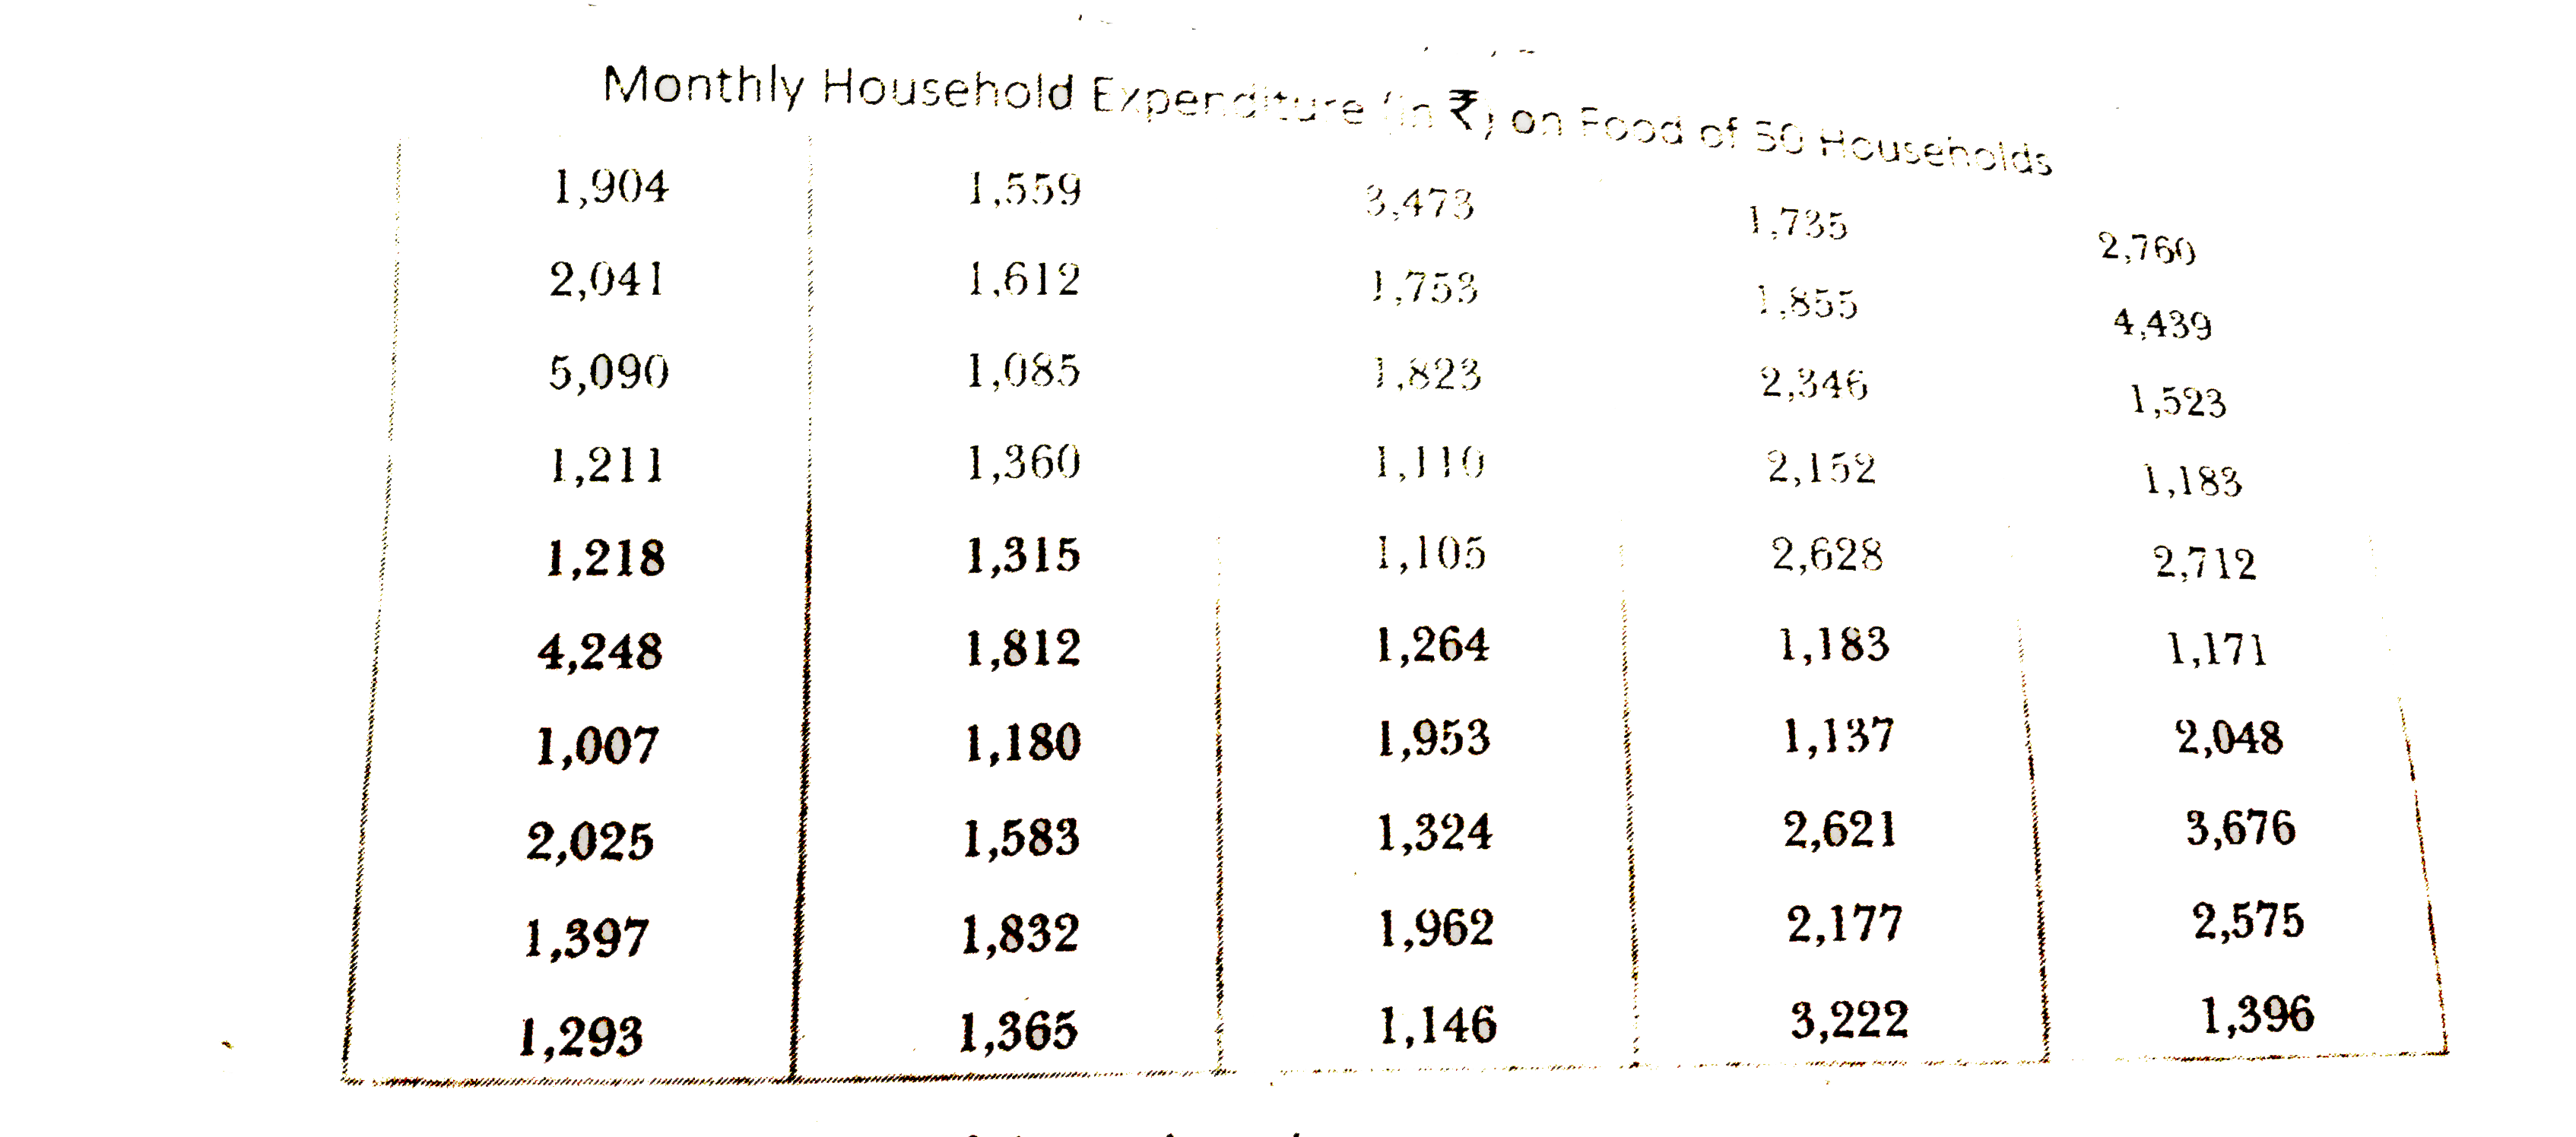
View SolutionUse the data in following table that relate to monthly household expenditure (in Rs.) on food of 50 households, and
(i) Obtain the range of monthly household expenditure on food.
(ii) Divide the range into appropriate number of class intervals and obtain the frequency distribution of expenditure.
(iii) Find the number of households whose monthly expenditure on food is
(a) less than Rs. 2,000, (b) more than Rs. 3,000, (c) between Rs. 1,500 and Rs. 500.
View SolutionIn the following table, the total expenditure of the labourers of a city is given

Find the average expenditure by deviation method.
View SolutionThe following table shows the frequency table of daily wages of 50 workers in a trading company. Find the mean wages of a worker, by assumed mean method.

View SolutionThe table shows income and expenditure of a person for 3 years
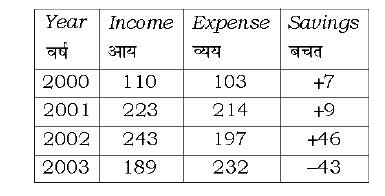
In the given table, what is the percentage of expenditure on income in the year 2002
View SolutionThe table shows Income and expenditure of a person for 3 years (in thousands):
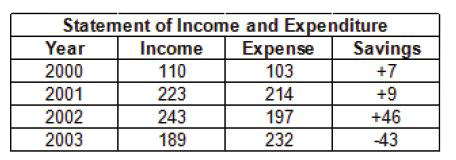
In the given table, what is the percentage of expenditure on income in the year 2002?(round off)
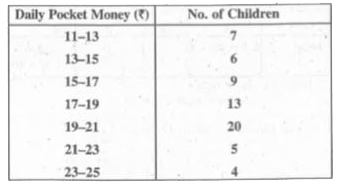
View SolutionThe following distribution shows the daily pocket money of children of a school.
Find the average daily pocket money of children.
View Solution
