The marks obtained by 100 students of class is an examination are given below:
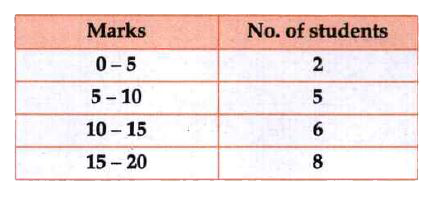
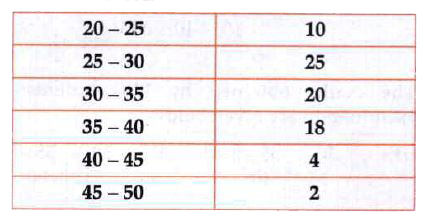
Draw 'a less than' type cumulative frequency curves (ogive). Hence, find median.
The correct Answer is:28.8
Topper's Solved these Questions
- STATISTICSBOOK - OSWAL PUBLICATIONCHAPTER - STATISTICSEXERCISE - Multiple Choice Questions
60 Videos
- STATISTICSBOOK - OSWAL PUBLICATIONCHAPTER - STATISTICSEXERCISE - Very Short Answer Type Questions
4 Videos
- STATISTICSBOOK - OSWAL PUBLICATIONCHAPTER - STATISTICSEXERCISE - BOARD CORNER (Short answer type questions)
5 Videos
- SOME APPLICATIONS OF TRIGONOMETRY (HEIGHTS AND DISTANCES) BOOK - OSWAL PUBLICATIONCHAPTER - SOME APPLICATIONS OF TRIGONOMETRY (HEIGHTS AND DISTANCES) EXERCISE - CASE-BASED MCQs
15 Videos
- SURFACE AREAS AND VOLUMES BOOK - OSWAL PUBLICATIONCHAPTER - SURFACE AREAS AND VOLUMES EXERCISE - BOARD CORNER (LONG ANSWER TYPE QUESTIONS)
9 Videos
Similar Questions
Draw a less than cumuative frequency curve (ogive) for the following distribution :

View SolutionDraw a less than cumuative frequency curve (ogive) for the following distribution :

View SolutionThe marks obtained by 200 students in an examination are given below. : Draw a less than ogive for the above distribution and use less than ogive to find median.
View SolutionThe marks obtained (out of 100) by a class of 80 students are given below
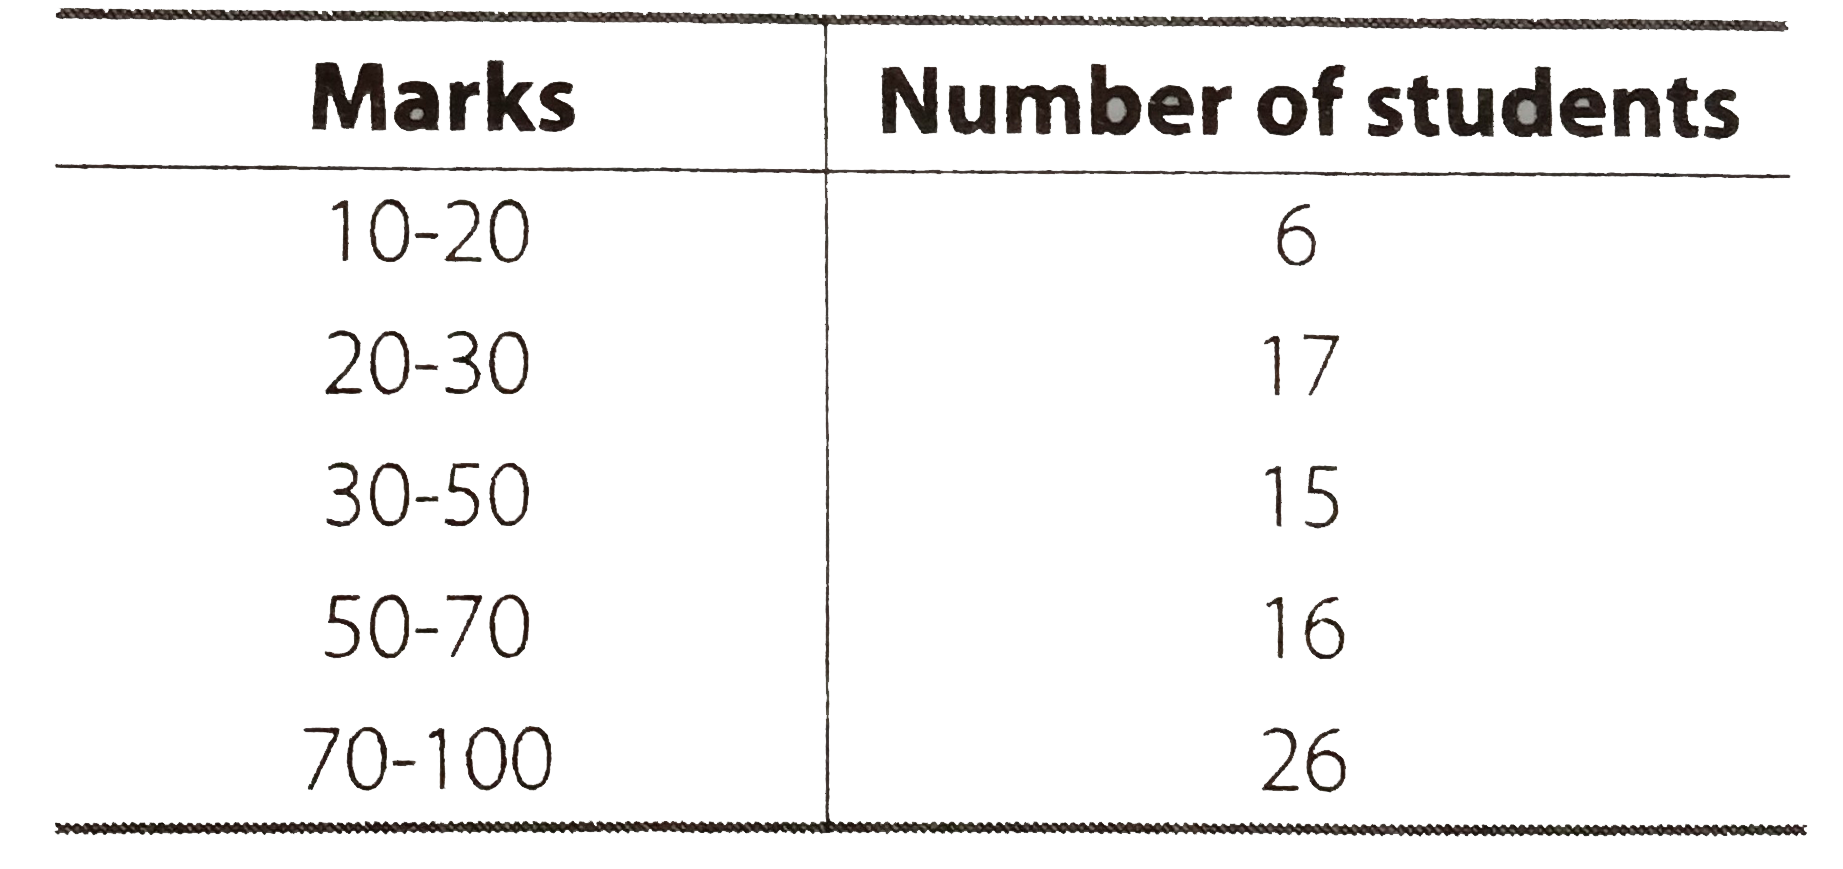
View SolutionMarks obtained by 100 students of a class are given below. Find out range and coefficient of range of the marks.

View SolutionThe marks obtained (out of 100) by 400 students in an examination are given below:
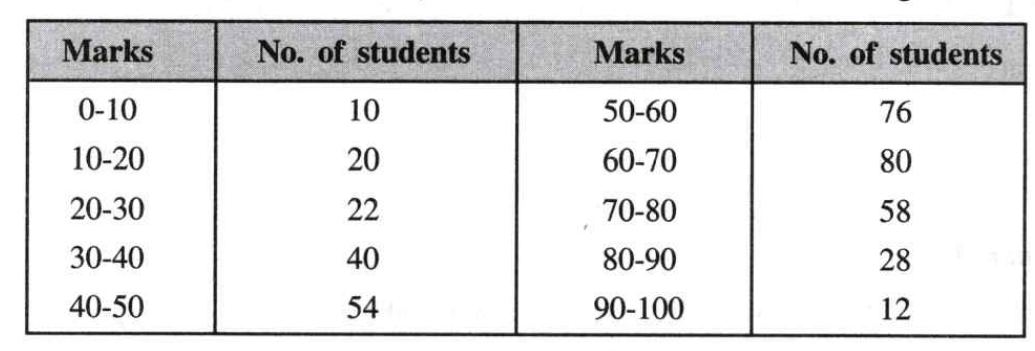
Using a graph paper, draw an ogive for the above distribution. Use ogive to estimate the following: estimate the median.
View SolutionThe marks obtained (out of 100) by 400 students in an examination are given below:

Using a graph paper, draw an ogive for the above distribution. Use ogive to estimate the following: estimate the number of students who obtained more than 80% marks in the examination.
View SolutionThe marks obtained (out of 100) by 400 students in an examination are given below:

Using a graph paper, draw an ogive for the above distribution. Use ogive to estimate:
the number of students who did not pass if the pass percentage was 35.
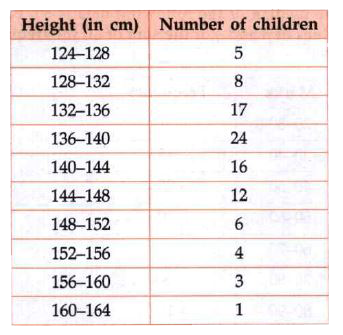
View SolutionThe distribution of heights (in cm) of 96 children is given below:
Draw a less than type cumulative frequency curve for this data and use it to compute median height of the children.
View SolutionMarks obtained by 200 students in an examination are given below :

Draw an ogive for the given distribution taking 2 cm = 10 marks on one axis and 2 cm = 20 students on the other axis. Using the graph, determine :
(i) The median marks
View Solution
