Complete the table using the data given in Graphs 2 and 3, answer the question that follows. Graph 2: Share of Sectors in GDP (%)
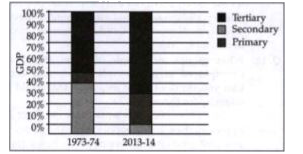
Graphs 3: Share in GDP Share in Employment(%)
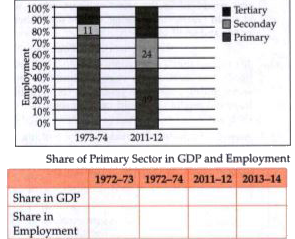
What are the changes that you observe in the primary sector over a span of 40 years ?
Share of Primary Sector in GDP and Employment

While the share of Primary sector in GDP has reduced drastically from 39% to 12%, the share of employment has reduced by a much lesser amount, from 74% to 49%.
Similar Questions
Study the given graph and answer the question that follows
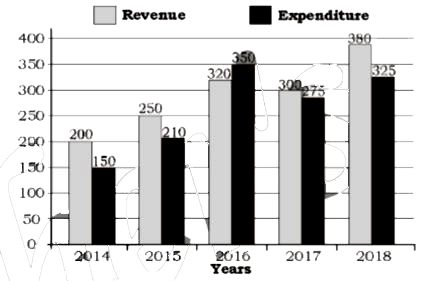
Total expenditure of the company in 2016, 2017 and 2018 is what percentage less than the total revenue in the given five years
View SolutionStudy the following graph and answer the question based on the graph.
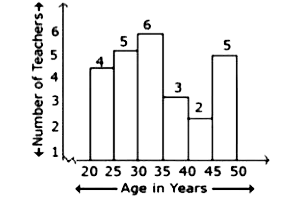
What percentage of the total number of teachers are aged less than 45 years?
View Solution
Knowledge Check
Study the following graph carefully and answer the questions that
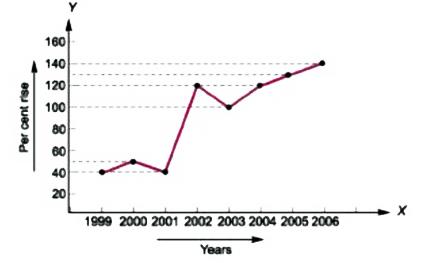
What was the average of percent rise over the given years ?A1.1B1.05C100.5%D92.5%Study the given graph and answer the question that follows.
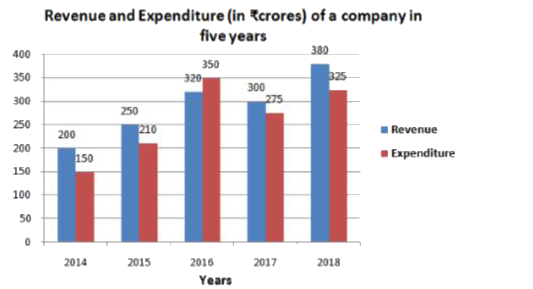
Total expenditure of the company in 2016, 2017 and 2018 is what percentage less than the total revenue in the given five years (correct to one decimal place)?A0.384B0.345C0.362D0.368Study the following graph carefully and answer the questions that follow
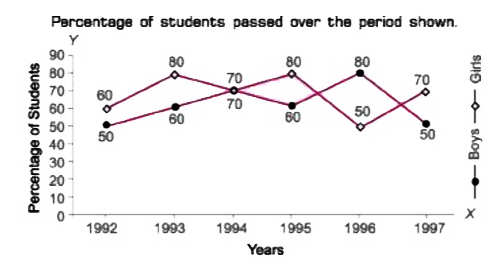
What is the over all percentage of failed boys over the period shown ?A6123B35C3513D3813
The Table below shows the estimated number of workers in India in the organized and unorganized sectors. Read the table carefully. Fill in the missing data and answer the questions that follows:
Workers in different sectors (In millions)
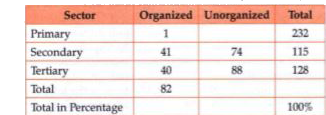
If we look at the country as a whole, we find that ____% of the workers in India are in the unorganized sector. Organized sector employment is available to only about __% of the workers in India.
View SolutionObserve the graph below and answer the following question
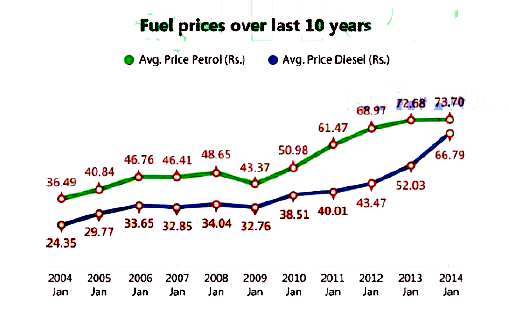
What is the average of diesel prices over the years 20062012?
View SolutionStudy the following graph carefully and answer the questions that follow
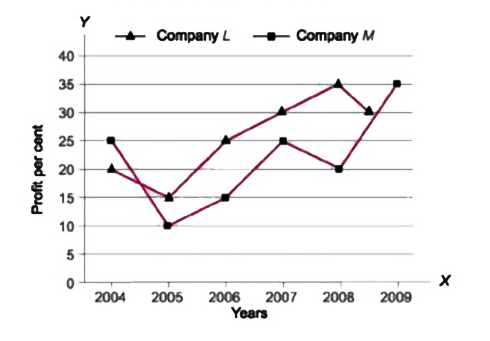
What was the percentage increase in percent rise in profit of company M in the year 2009 from the previous year ?
View SolutionStudy the table graph carefully to answer the questions that follows
Production of main crops in India (in million tonnes)
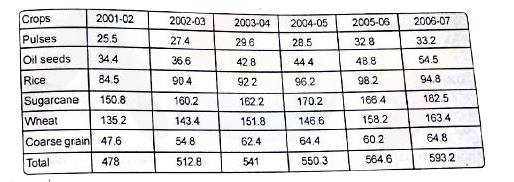
Production of rice was what percentage of the total crops produced in the year 2001-02 ?
View SolutionStudy the following graph carefully and answer the questions that follow
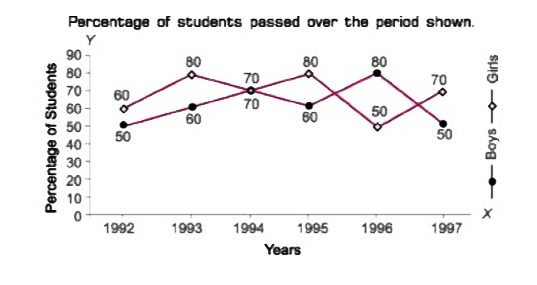
For how many years was there a paired rise or fall in the percentage of boys and girls passed over the period shown ?
View Solution
