The Table below shows the estimated number of workers in India in the organized and unorganized sectors. Read the table carefully. Fill in the missing data and answer the questions that follows:
Workers in different sectors (In millions)
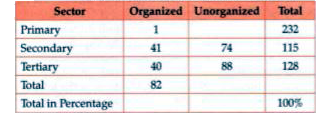
What is the percentage of people in the organized sector in agriculture?
it is only 17.26%
Similar Questions
The Table below shows the estimated number of workers in India in the organized and unorganized sectors. Read the table carefully. Fill in the missing data and answer the questions that follows:
Workers in different sectors (In millions)

Do you agree that agriculture is an unorganized sector activity? Why?
View SolutionThe Table below shows the estimated number of workers in India in the organized and unorganized sectors. Read the table carefully. Fill in the missing data and answer the questions that follows:
Workers in different sectors (In millions)
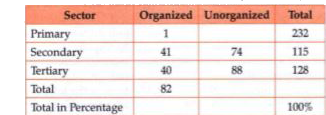
If we look at the country as a whole, we find that ____% of the workers in India are in the unorganized sector. Organized sector employment is available to only about __% of the workers in India.
View Solution
Knowledge Check
Study the table graph carefully to answer the questions that follows
Production of main crops in India (in million tonnes)
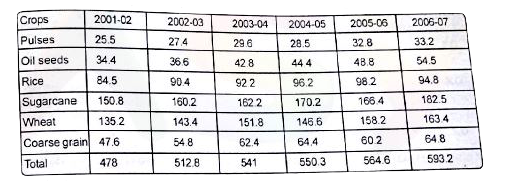
What was the average production of rice in the given years?A98 Million tonnesB95 Million tonnesC92.38 Million tonnesD100 Million tonnesStudy the table graph carefully to answer the questions that follows
Production of main crops in India (in million tonnes)
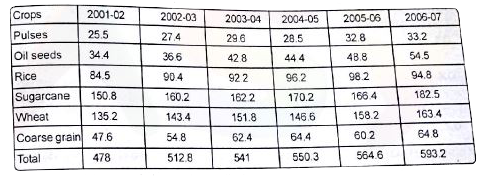
What is the difference of average production of Pulses and Sugarcane ?A100B150C165D135Study the table graph carefully to answer the questions that follows
Production of main crops in India (in million tonnes)
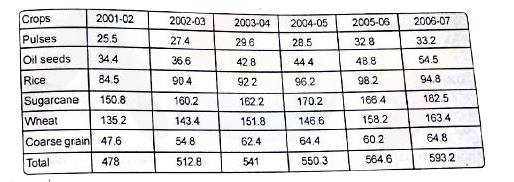
Production of rice was what percentage of the total crops produced in the year 2001-02 ?A18.5B19.2C21.7D17.6
A research scholar looked at the working people in the city of Surat and found the following:

Complete the table. What is the percentage of people in the unorganized sector in this city?
View SolutionDirection: Study the chart and answer the following questions

What is the average expenditure spent on different five sector over the year?
View SolutionThe given pie chart shows the percentage distribution of 450 employees in an organisation. Read the pie chart and answer the question that follows.
Percentage of Employees in different Departments (Total 450 Employees )
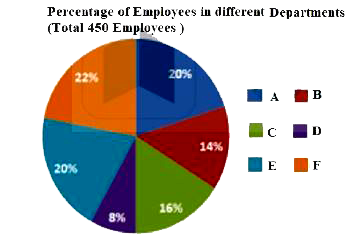
What is the central angle of the sector representing the number of employees in department E?
View SolutionRead the following table carefully and answer the questions given below
percentage marks obtained by 6 students in different subjects

What is the average marks obtained by all students in Geography ?
View SolutionRead the following table carefully and answer the questions given below
percentage marks obtained by 6 students in different subjects

What is the approximate percentage marks obtained by student T in all the subjects together ?
View Solution
