The teacher user charts as tools to generate interest in students. Which of the data sets could be plotted on a pie chart?
The total population of the top five largest U.S. cities
The incubation period of a penguin colony as it re-later to hours of daylight.
The distribution of weight among players of a football team.
The percent of vegetation cover and precipitation rates in different national parks.
The correct Answer is:A
Similar Questions
Students of a class voted for their favourite colour and a pie chart was prepared based on the data collected.
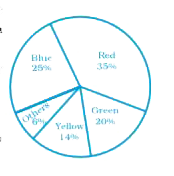
Observe the pie chart given below and answer questions based on it.
Which of the following is a reasonable conclusion for the given data?
View SolutionData collected in a survey shows that 40% of the buyers are interested in buying a particular brand of toothpaste. The central angle of the sector of the pie chart representing this information is
View Solution
Knowledge Check
The pie-chart shows percentage wise distribution of teachers who teach six different subjects. Study the pie chart and answer the question :
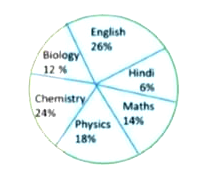
Total number of teachers =1650
What is the difference between the total number of teachers who teach Physics and Maths and the total number of teachers who tech chemistry and biology ?Aa) 60Bb) 76Cc) 66Dd) 68Study the Pie chart carefully and answer the questions.
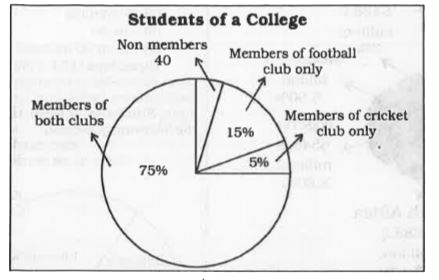
Percentage of students who are not members of any club is :A5%B8%C10%D6%
The pie chart shows percentage wise distribution of teachers who teach six different subjects. Study the pie chart and answer the question.
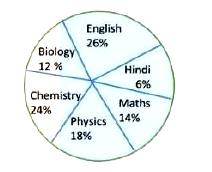
Total number of teachers = 1650
What is the difference between the total number of teachers who teach Physics and Maths and the total number of teachers who teach chemistry and biology?
View SolutionGiven below is the result of an annual examination of a class, showing the percentage of students in each category .

Represent the above data by a pie chart.
View SolutionThe given pie chart shows favorite sport of students of A school
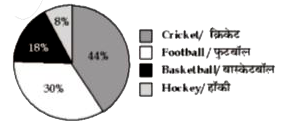
In the given pie chart if the school strength was 2500 how many liked cricket more than hockey?
View SolutionThe pie-chart shows percentage wise distribution of teachers who teach six different subjects. Study the pie chart and answer the question:
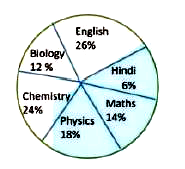
Total number of teachers = 1650
What is the total number of teachers teaching English. Maths and Physics?
View SolutionThe number of students in a hostel, speaking different languages is given below. Display the data in a pie chart.

View SolutionThe number of students in a hostel, speaking different languages is given below. Display the data in a pie chart.
View Solution
