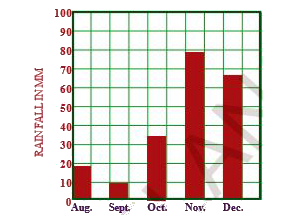
Observe the graph showing rainfall (in mm) of a place from August to December. Write down the observations from it.
 Solution in Telugu
Step by step video & image solution for Observe the graph showing rainfall (in mm) of a place from August to December. Write down the observations from it. by Chemistry experts to help you in doubts & scoring excellent marks in Class 7 exams.
Updated on:21/07/2023Topper's Solved these Questions
Similar Questions
What is sewage ? Explain why it is harmful to discharge untreated sewage into rivers or seas?
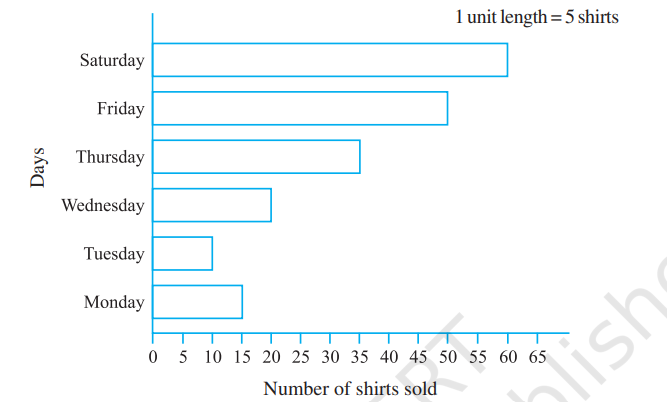
View SolutionObserve this bar graph which is showing the sale of shirts in a ready made shop from Monday to Saturday

View SolutionAs observed from a place in Australia the pole star
View SolutionObserve this bar graph which is showing the sale of shirts in a ready made shop from Monday to Saturday
View SolutionWorld animal day is observed on 3rd December .
View SolutionSuppose the mean of certain number of observation is 50 and the sum of all the observation is 450. Write down the number of observations.
View SolutionWrite down the observation for the following: Ammonia carbonate is heated.
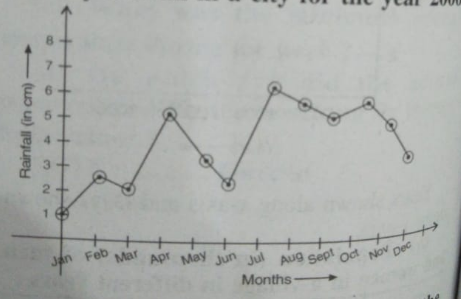
View SolutionThe graph in the figure shows the monthly rainfall in a city for the year 2006.
Observe the graph and answer the following questions:
Which was the wettest month?
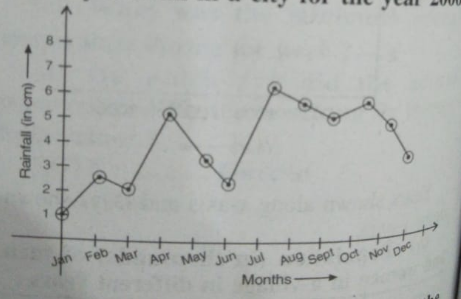
View SolutionThe graph in the figure shows the monthly rainfall in a city for the year 2006.
Observe the graph and answer the following questions:
In which month was the rainfall minimum ?How much was it?
View SolutionDecember 19 is observed asV
View SolutionDecember 17 is observed as
View SolutionDecember 9 is observed as
View SolutionDecember 1 is observed as
View SolutionAugust 19 is observed as
View SolutionOn which of the following date/dates, winter solstice is observed in Northern Hemisphere?
I. 21st December
II. 5th August
III. 10th January
View Solutionनिम्नलिखित में से किस/किन तिथि/तिथियों पर उत्तरी गोलार्द्ध में शीतकाल अयनांत को देखा जाता है ?
I.21 दिसम्बर II.5 अगस्त III. 10 जनवरी
View Solution
