Observe this bar graph which is showing the sale of shirts in a ready made shop from Monday to Saturday
a) The above bar graph gives the information about the sale of shirts in a ready-made shop from Monday to Saturday.
b) The scale chosen to represent the number of shirts on the horizontal line is 1 unit length = 5 sold shirts.
c) On Saturday, the maximum shirts were sold for the week. 60 sold.
Topper's Solved these Questions
- DATA HANDLINGBOOK - NCERT ENGLISHCHAPTER - DATA HANDLINGEXERCISE - EXERCISE 9.4
4 Videos
- DATA HANDLINGBOOK - NCERT ENGLISHCHAPTER - DATA HANDLINGEXERCISE - EXERCISE 9.1
7 Videos
- DATA HANDLINGBOOK - NCERT ENGLISHCHAPTER - DATA HANDLINGEXERCISE - SOLVED EXAMPLES
9 Videos
- BASIC GEOMETRICAL IDEASBOOK - NCERT ENGLISHCHAPTER - BASIC GEOMETRICAL IDEASEXERCISE - EXERCISE 4.6
4 Videos
- DECIMALSBOOK - NCERT ENGLISHCHAPTER - DECIMALSEXERCISE - EXERCISE 8.3
2 Videos
Similar Questions
Observe this bar graph which shows the marks obtained by Aziz in half-yearly examination in different subjects.
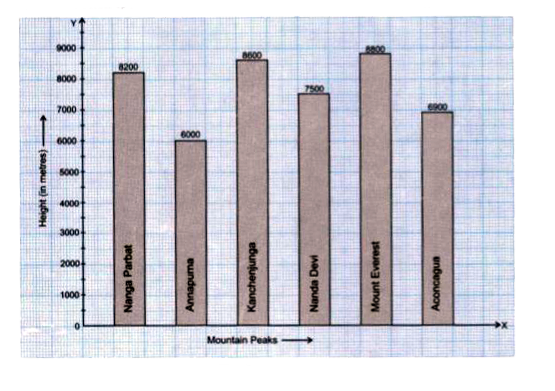
View SolutionGiven below is a bar graph showing the heights of six mountain peaks.

Read the above bar diagram and answer the following questions :
what is information given in the graph
View Solution
Knowledge Check
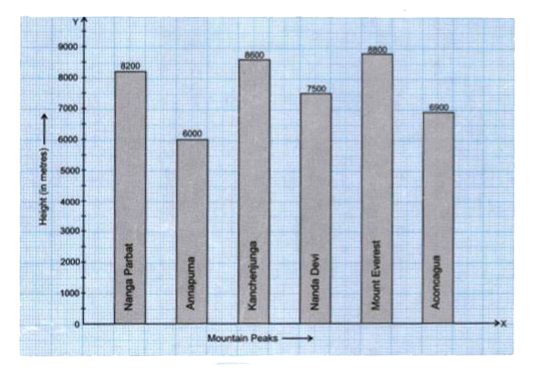
Given below is a bar graph showing the heights of six mountain peaks.

Read the above bar diagram and answer the following questions :
Which peak is second highest and what is it's height.AMount Everest, 8800 mBKanchan Junga, 8600 mCNanga Parbat, 8200 mDAnnapurma, 6000 m
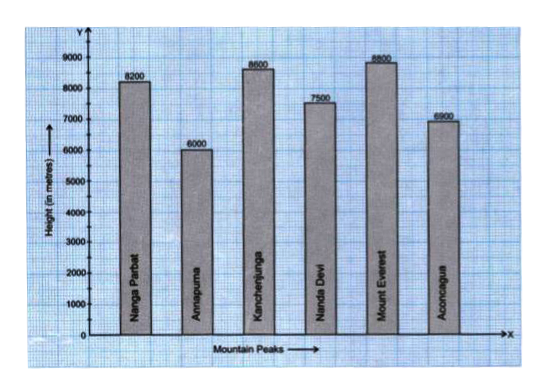
Given below is a bar graph showing the heights of six mountain peaks.

Read the above bar diagram and answer the following questions :
What is the highest mountain peak?
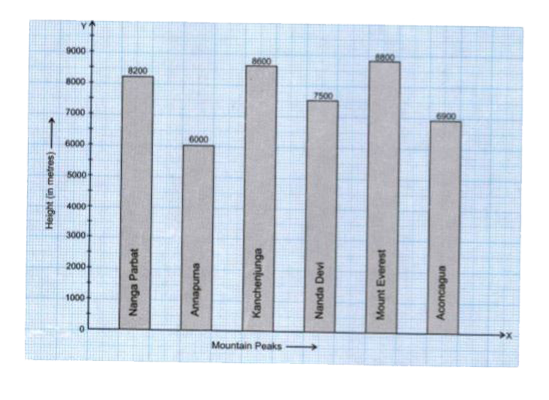
View SolutionGiven below is a bar graph showing the heights of six mountain peaks.

Read the above bar diagram and answer the following questions :
Find the ratio between highest and lowest mountain peak
View SolutionDraw a bar graph from the following data:

View SolutionGiven below is a bar graph showing the heights of five mountain peaks.
Read the bar graph carefully and answer the following questions:
(i) Which is the highest peak and what is its height?
(ii) What is the ratio of the heights of the highest peak and the next highest peak?
(iii) Arrange the heights of the given peaks in descending order.
View SolutionRead the following bar graph shown in Figure and answer the following questions: What is the information given by the bar graph? In which month was the sale of the book maximum? In which month was the sale of the book minimum? What is the total sale of the book during these five months?
View SolutionRead the following bar graph shown in Figure and answer the following questions: What is the information given by the bar graph? In which month was the sale of the book maximum? In which month was the sale of the book minimum? What is the total sale of the book during these five months?
View SolutionDraw a graph to show the deviation of real gas from Boyle's law.
View Solution
