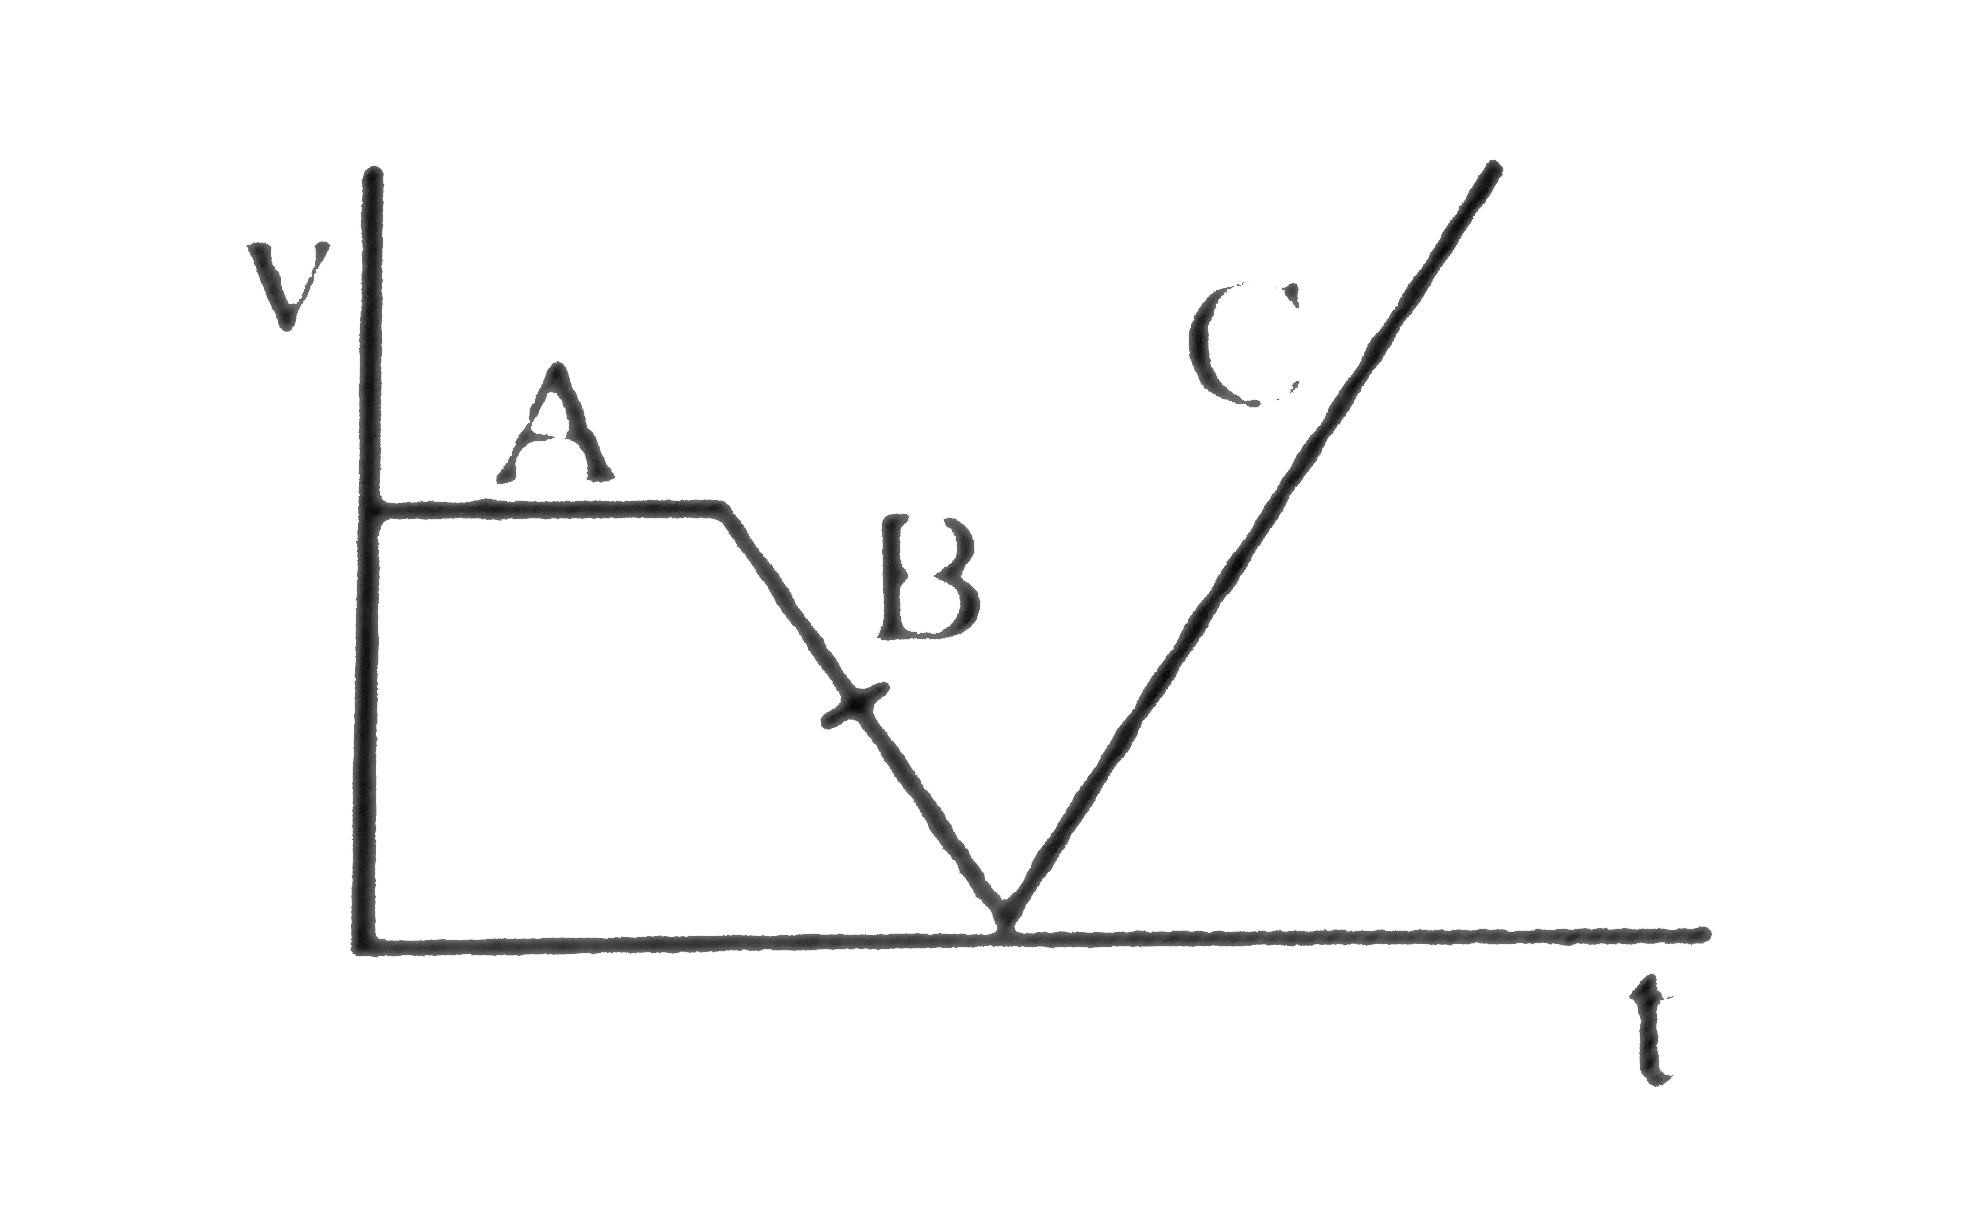
Graph of a body is shown. It explains that

at B force is zero
at B there is a force but towards motion
at B there is a force which opposes motion
at B the force may be in any direction
The correct Answer is:C
Step by step video & image solution for Graph of a body is shown. It explains that by Physics experts to help you in doubts & scoring excellent marks in Class 12 exams.
Updated on:21/07/2023Similar Questions
Knowledge Check
The velocity time graph of a body is shown in fig. 3.3. it implies that at point B
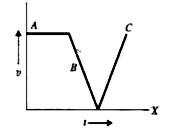 Athe force is zeroBthere is a force towards motionCthere is force which oppose motionDnone of the above
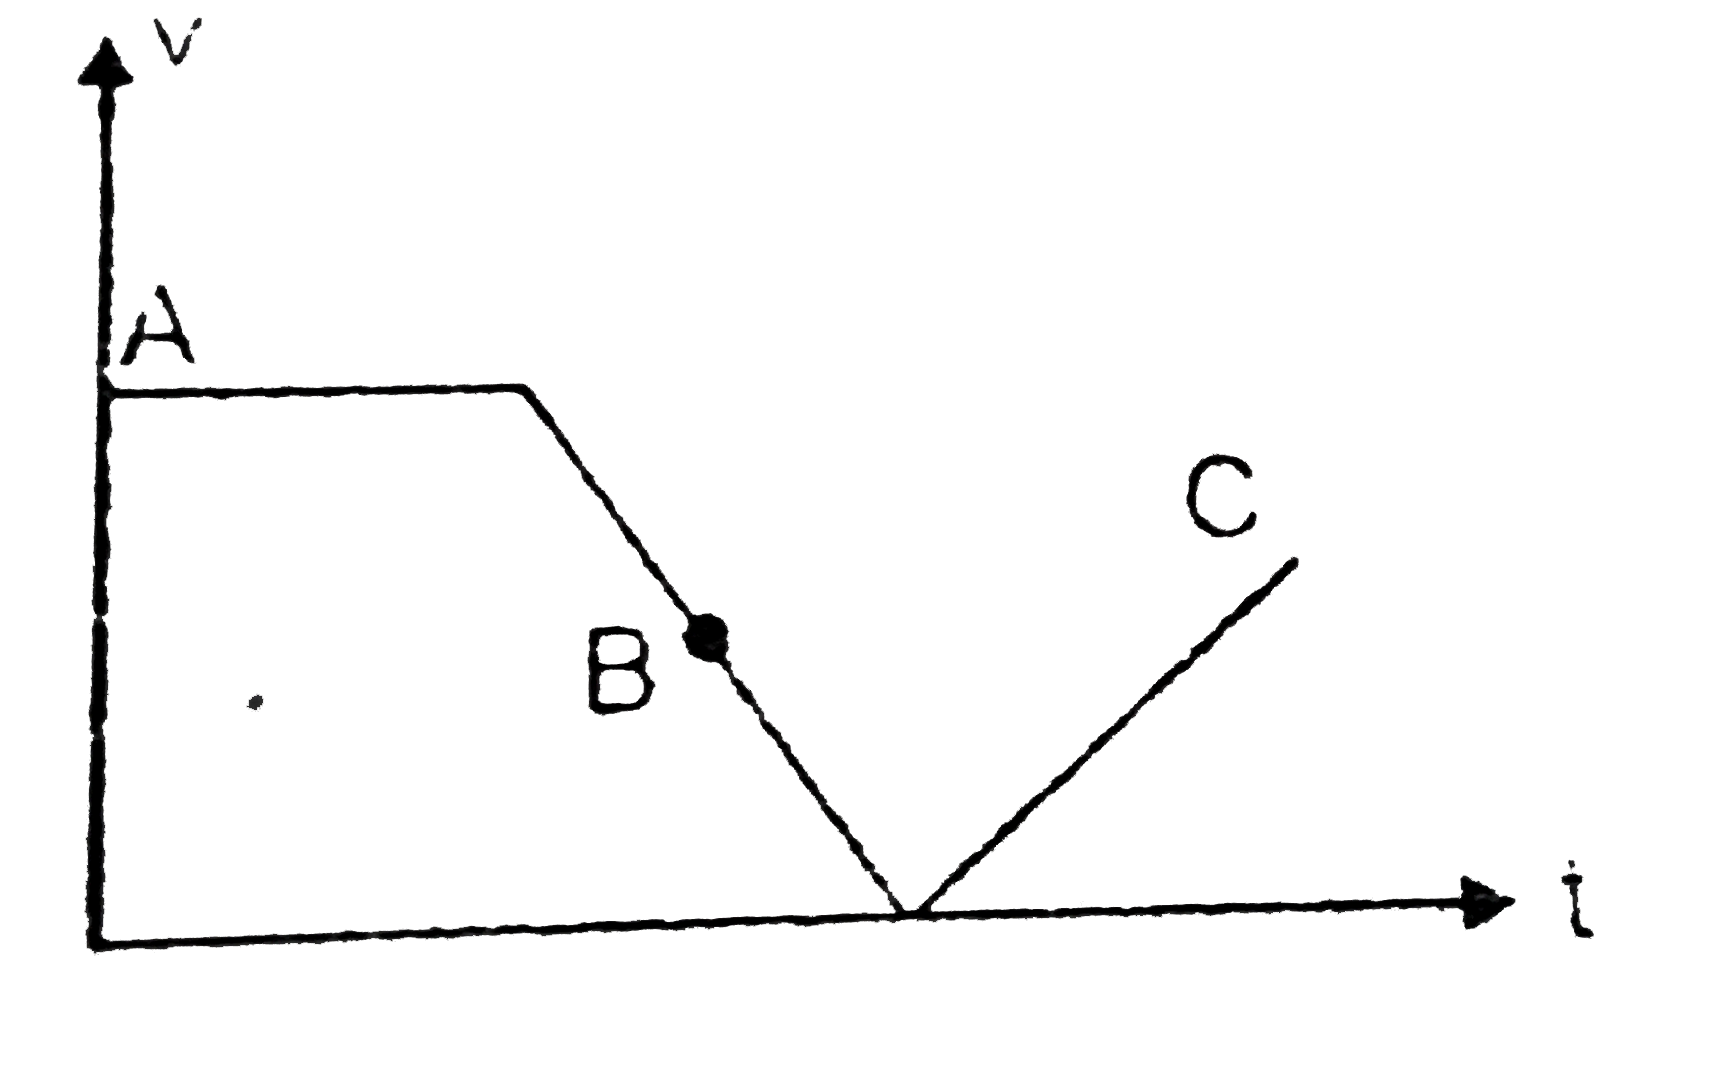
The velocity time graph of a body is shown in fig. it indicates that :
View Solution
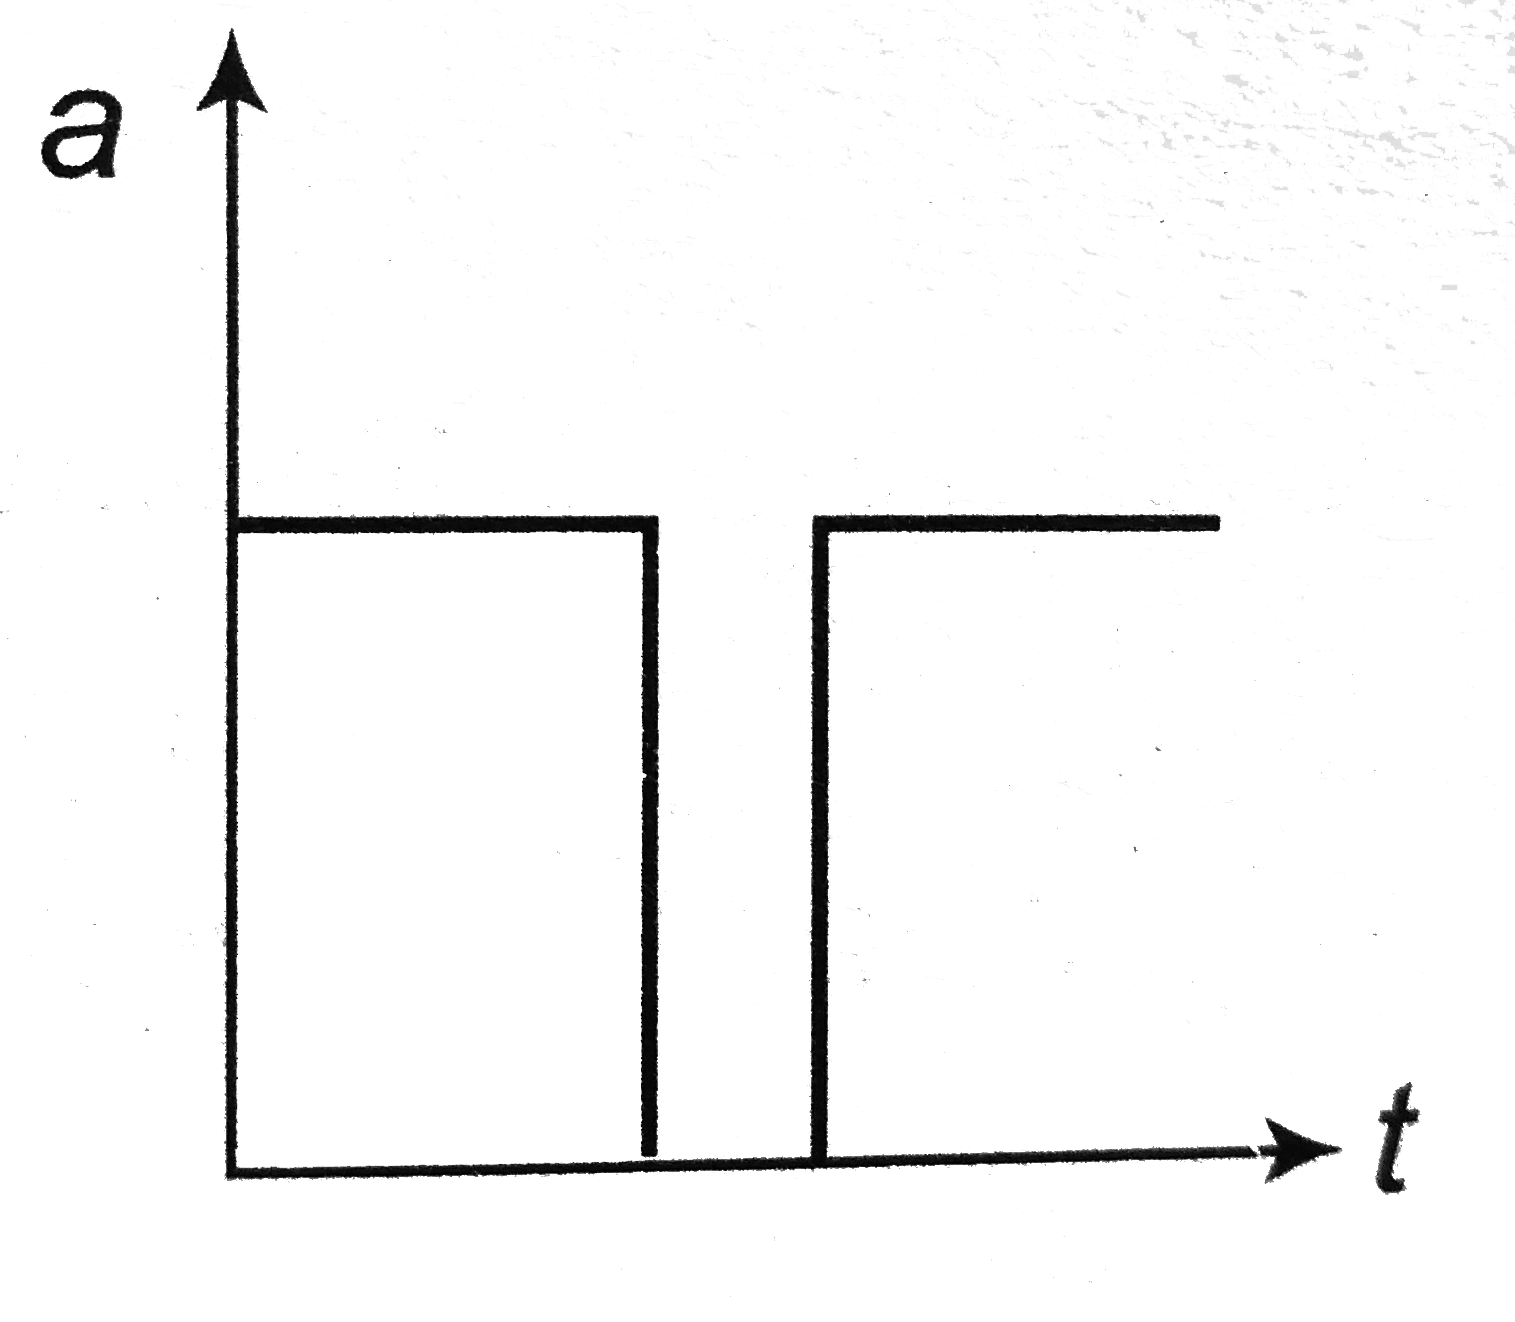
The acceleration time graph of a body is shown below the most probable velocity time graph of the body is
View SolutionAcceleration-time graph of a body is shown. The corresponding velocity-time graph of the same body is.
View SolutionThe velocity - time graph of a body is shown in fig. The ratio of the .....during the intervals OA and AB is _______

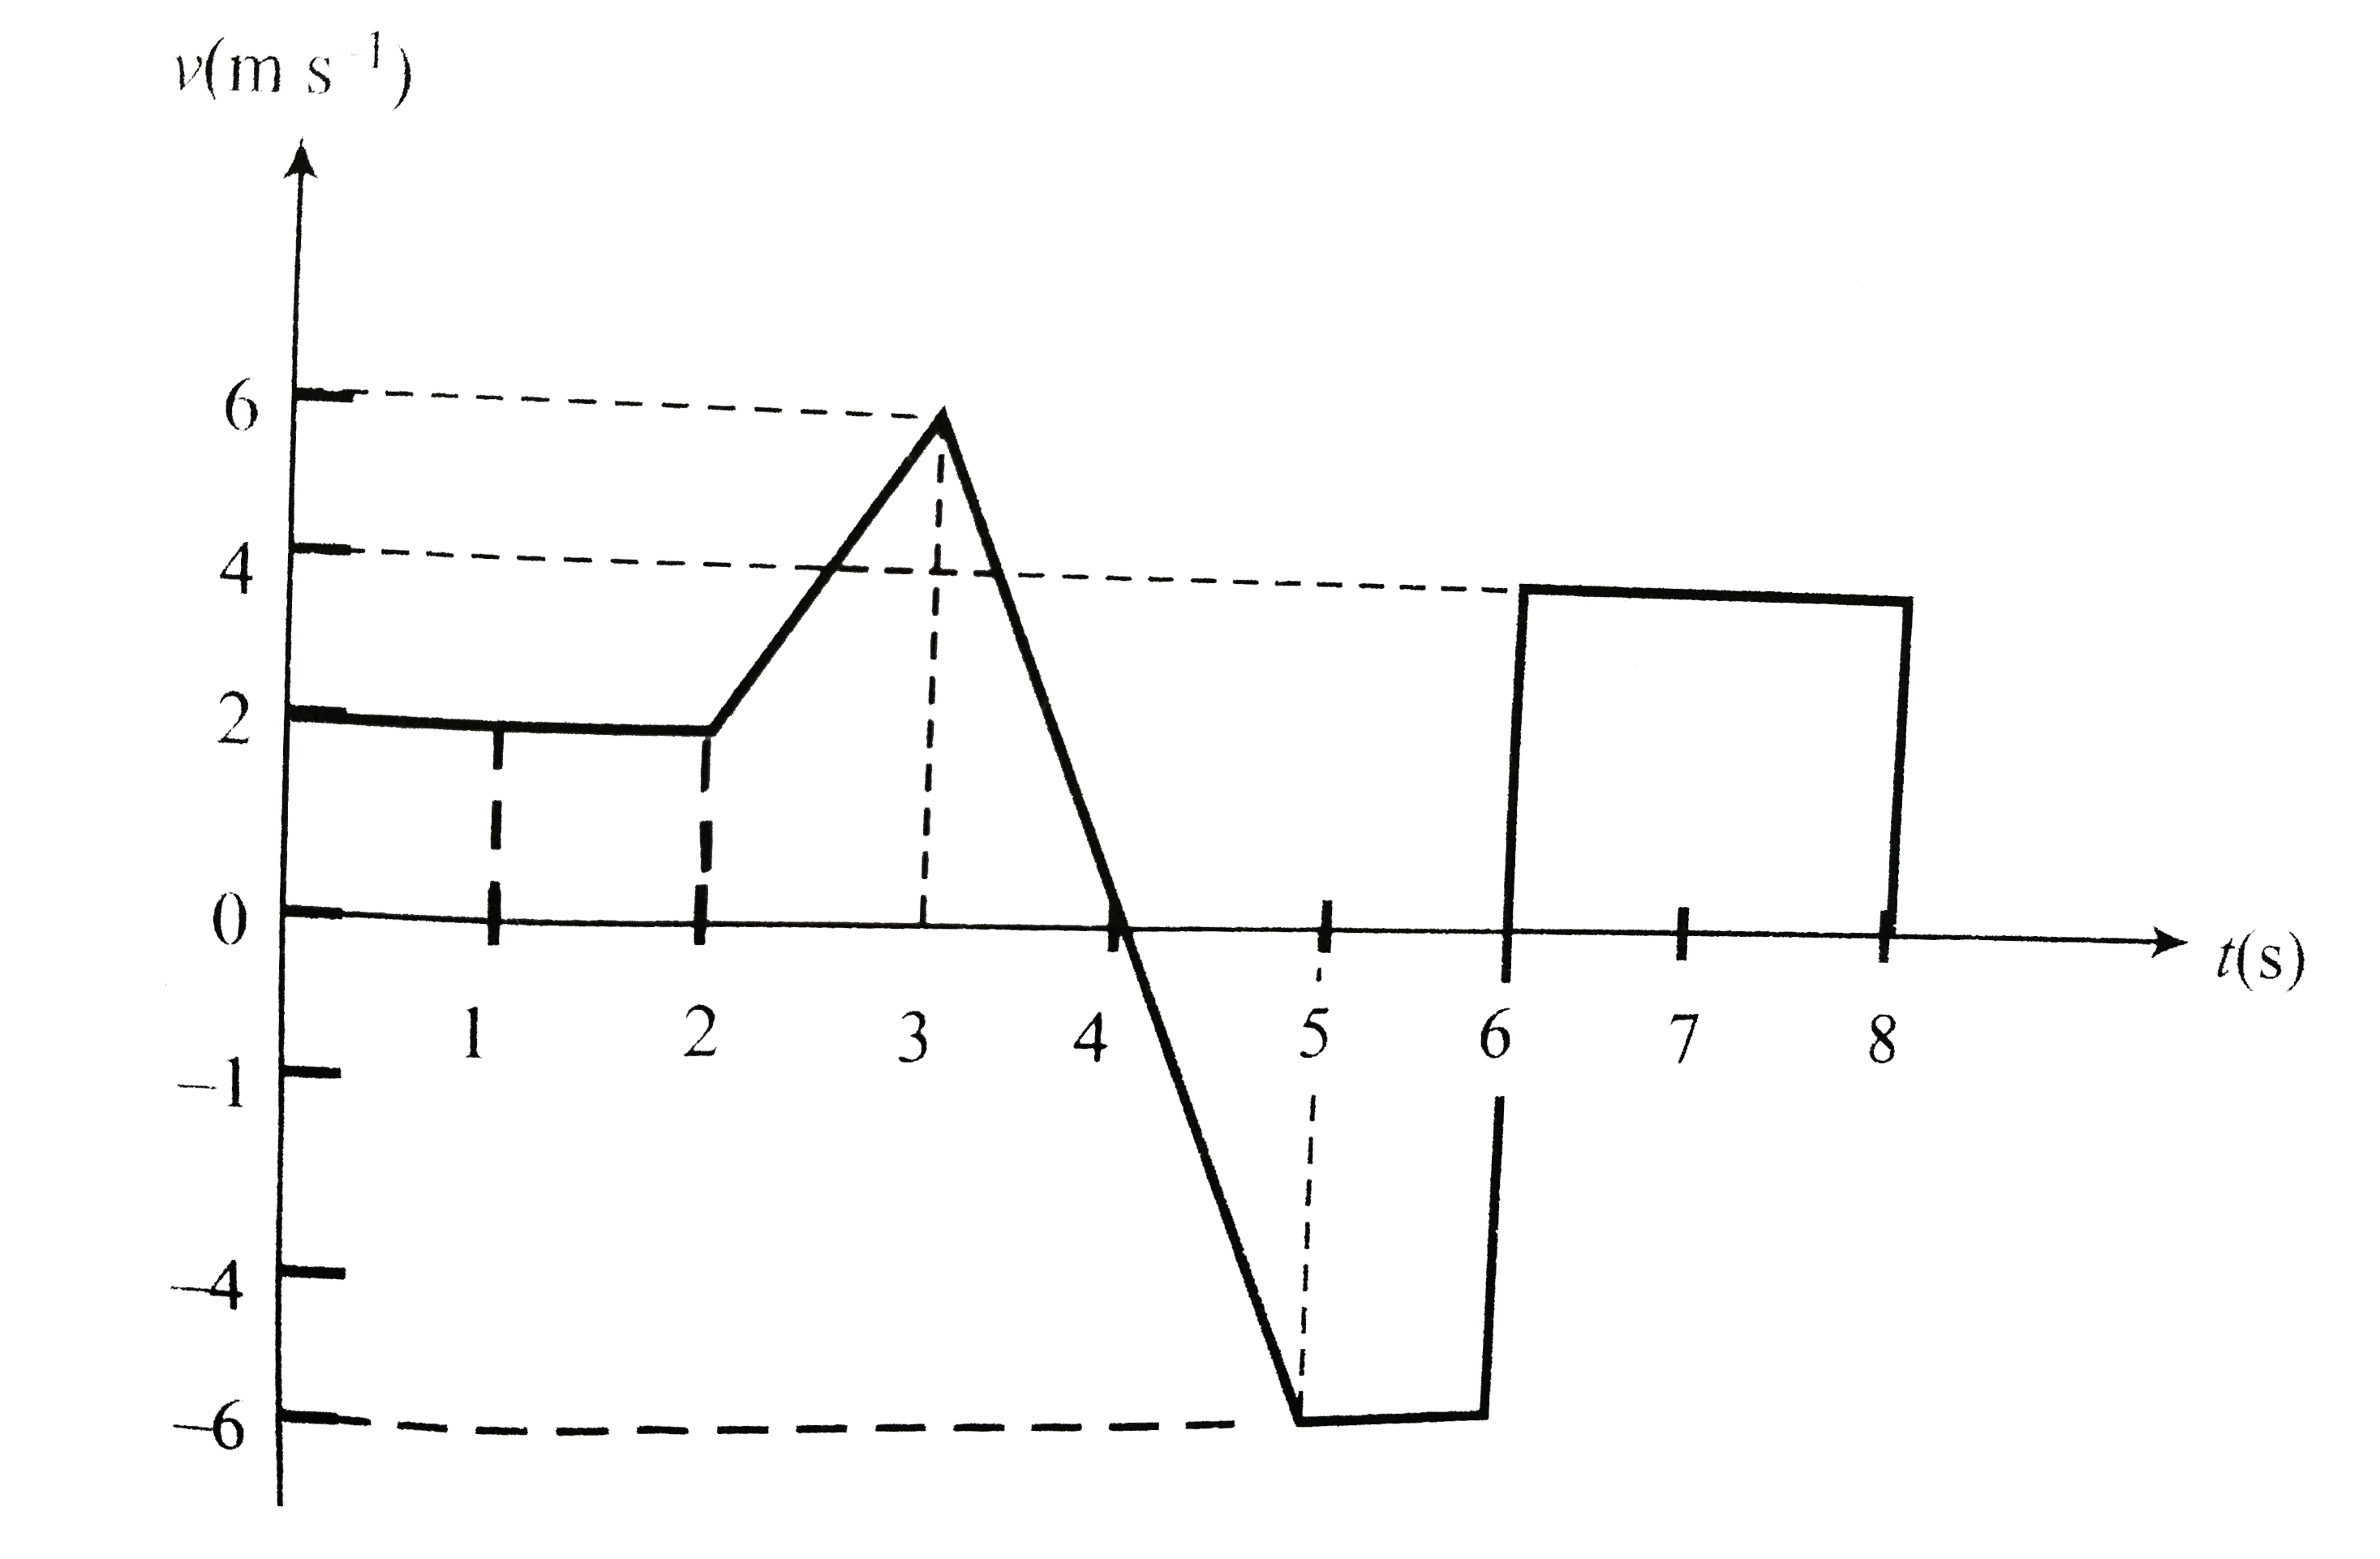
View SolutionThe velocity-time graph of a body is shown in .
The displacement of the body in 8s is.
 .
.
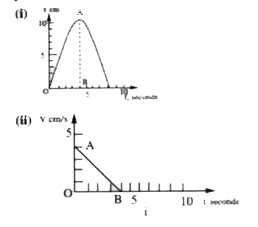
View SolutionThe graphs in (i) and (ii) show the S-t graph and V -t graph of a body. Are the motions shown in the graphs represented by OAB the same ?
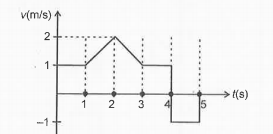
View SolutionThe velocity-time graph of a body is shown below. The displacement covered by body in 5 s is
View Solution

 .
.