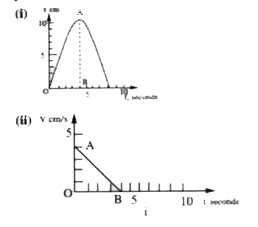
The graphs in (i) and (ii) show the S-t graph and V -t graph of a body. Are the motions shown in the graphs represented by OAB the same ?
The motion shown by the two graphs are not same.
(i) In the given s-t graph OA, is a uniform retardation motion.
Here, displacement =(average velocity) x (time)
using
(ii)In the given V-t graph
OA is a uniform retardation of motion
a =slope of the line -
Thus the two graphs even though represent uniform retardation motions, the magnitudes are not equal.
Topper's Solved these Questions
- BOOK - AAKASH SERIESCHAPTER - MOTION IN A STRAIGHT LINE EXERCISE - EXERCISE -I58videos
MOTION IN A STRAIGHT LINE
- BOOK - AAKASH SERIESCHAPTER - MOTION IN A STRAIGHT LINE EXERCISE - EXERCISE -II80videos
MOTION IN A STRAIGHT LINE
- BOOK - AAKASH SERIESCHAPTER - MOTION IN A PLANEEXERCISE - QUESTION FOR DESCRIPTIVE ANSWER7videos
MOTION IN A PLANE
- BOOK - AAKASH SERIESCHAPTER - MOVING CHARGES AND MAGNETISMEXERCISE - EXERCISE-III49videos
MOVING CHARGES AND MAGNETISM
Similar Questions
Graph of a body is shown. It explains that
 View Solution
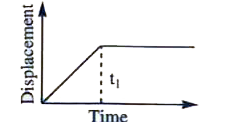
The x-t graph shown in figure represents.
 View Solution
The x-t graph shown in figure represents
 View Solution
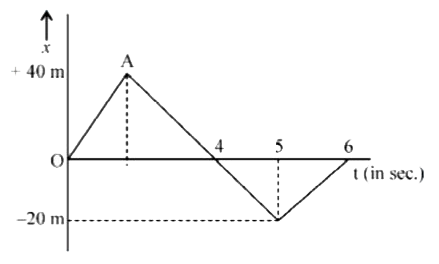
s-t graph of a particle in motion is shown in Fig. Calculate
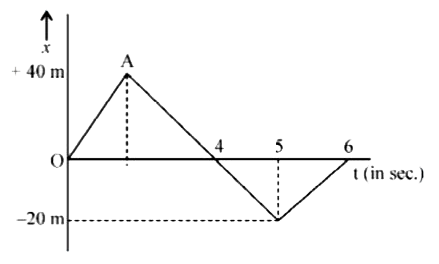
Average speedView Solutions-t graph of a particle in motion is shown in Fig. Calculate
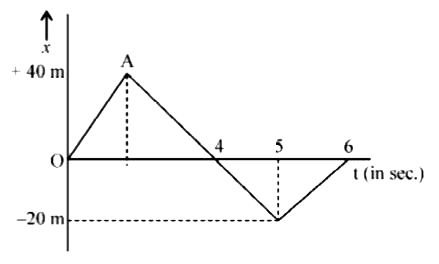
DisplacementView Solutions-t graph of a particle in motion is shown in Fig. Calculate
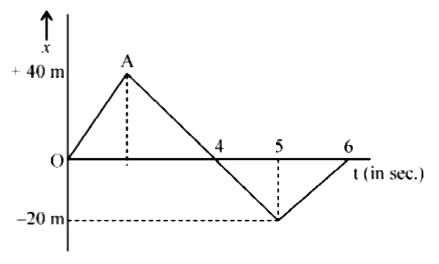
Total covered distanceView Solutions-t graph of a particle in motion is shown in Fig. Calculate Average velocity
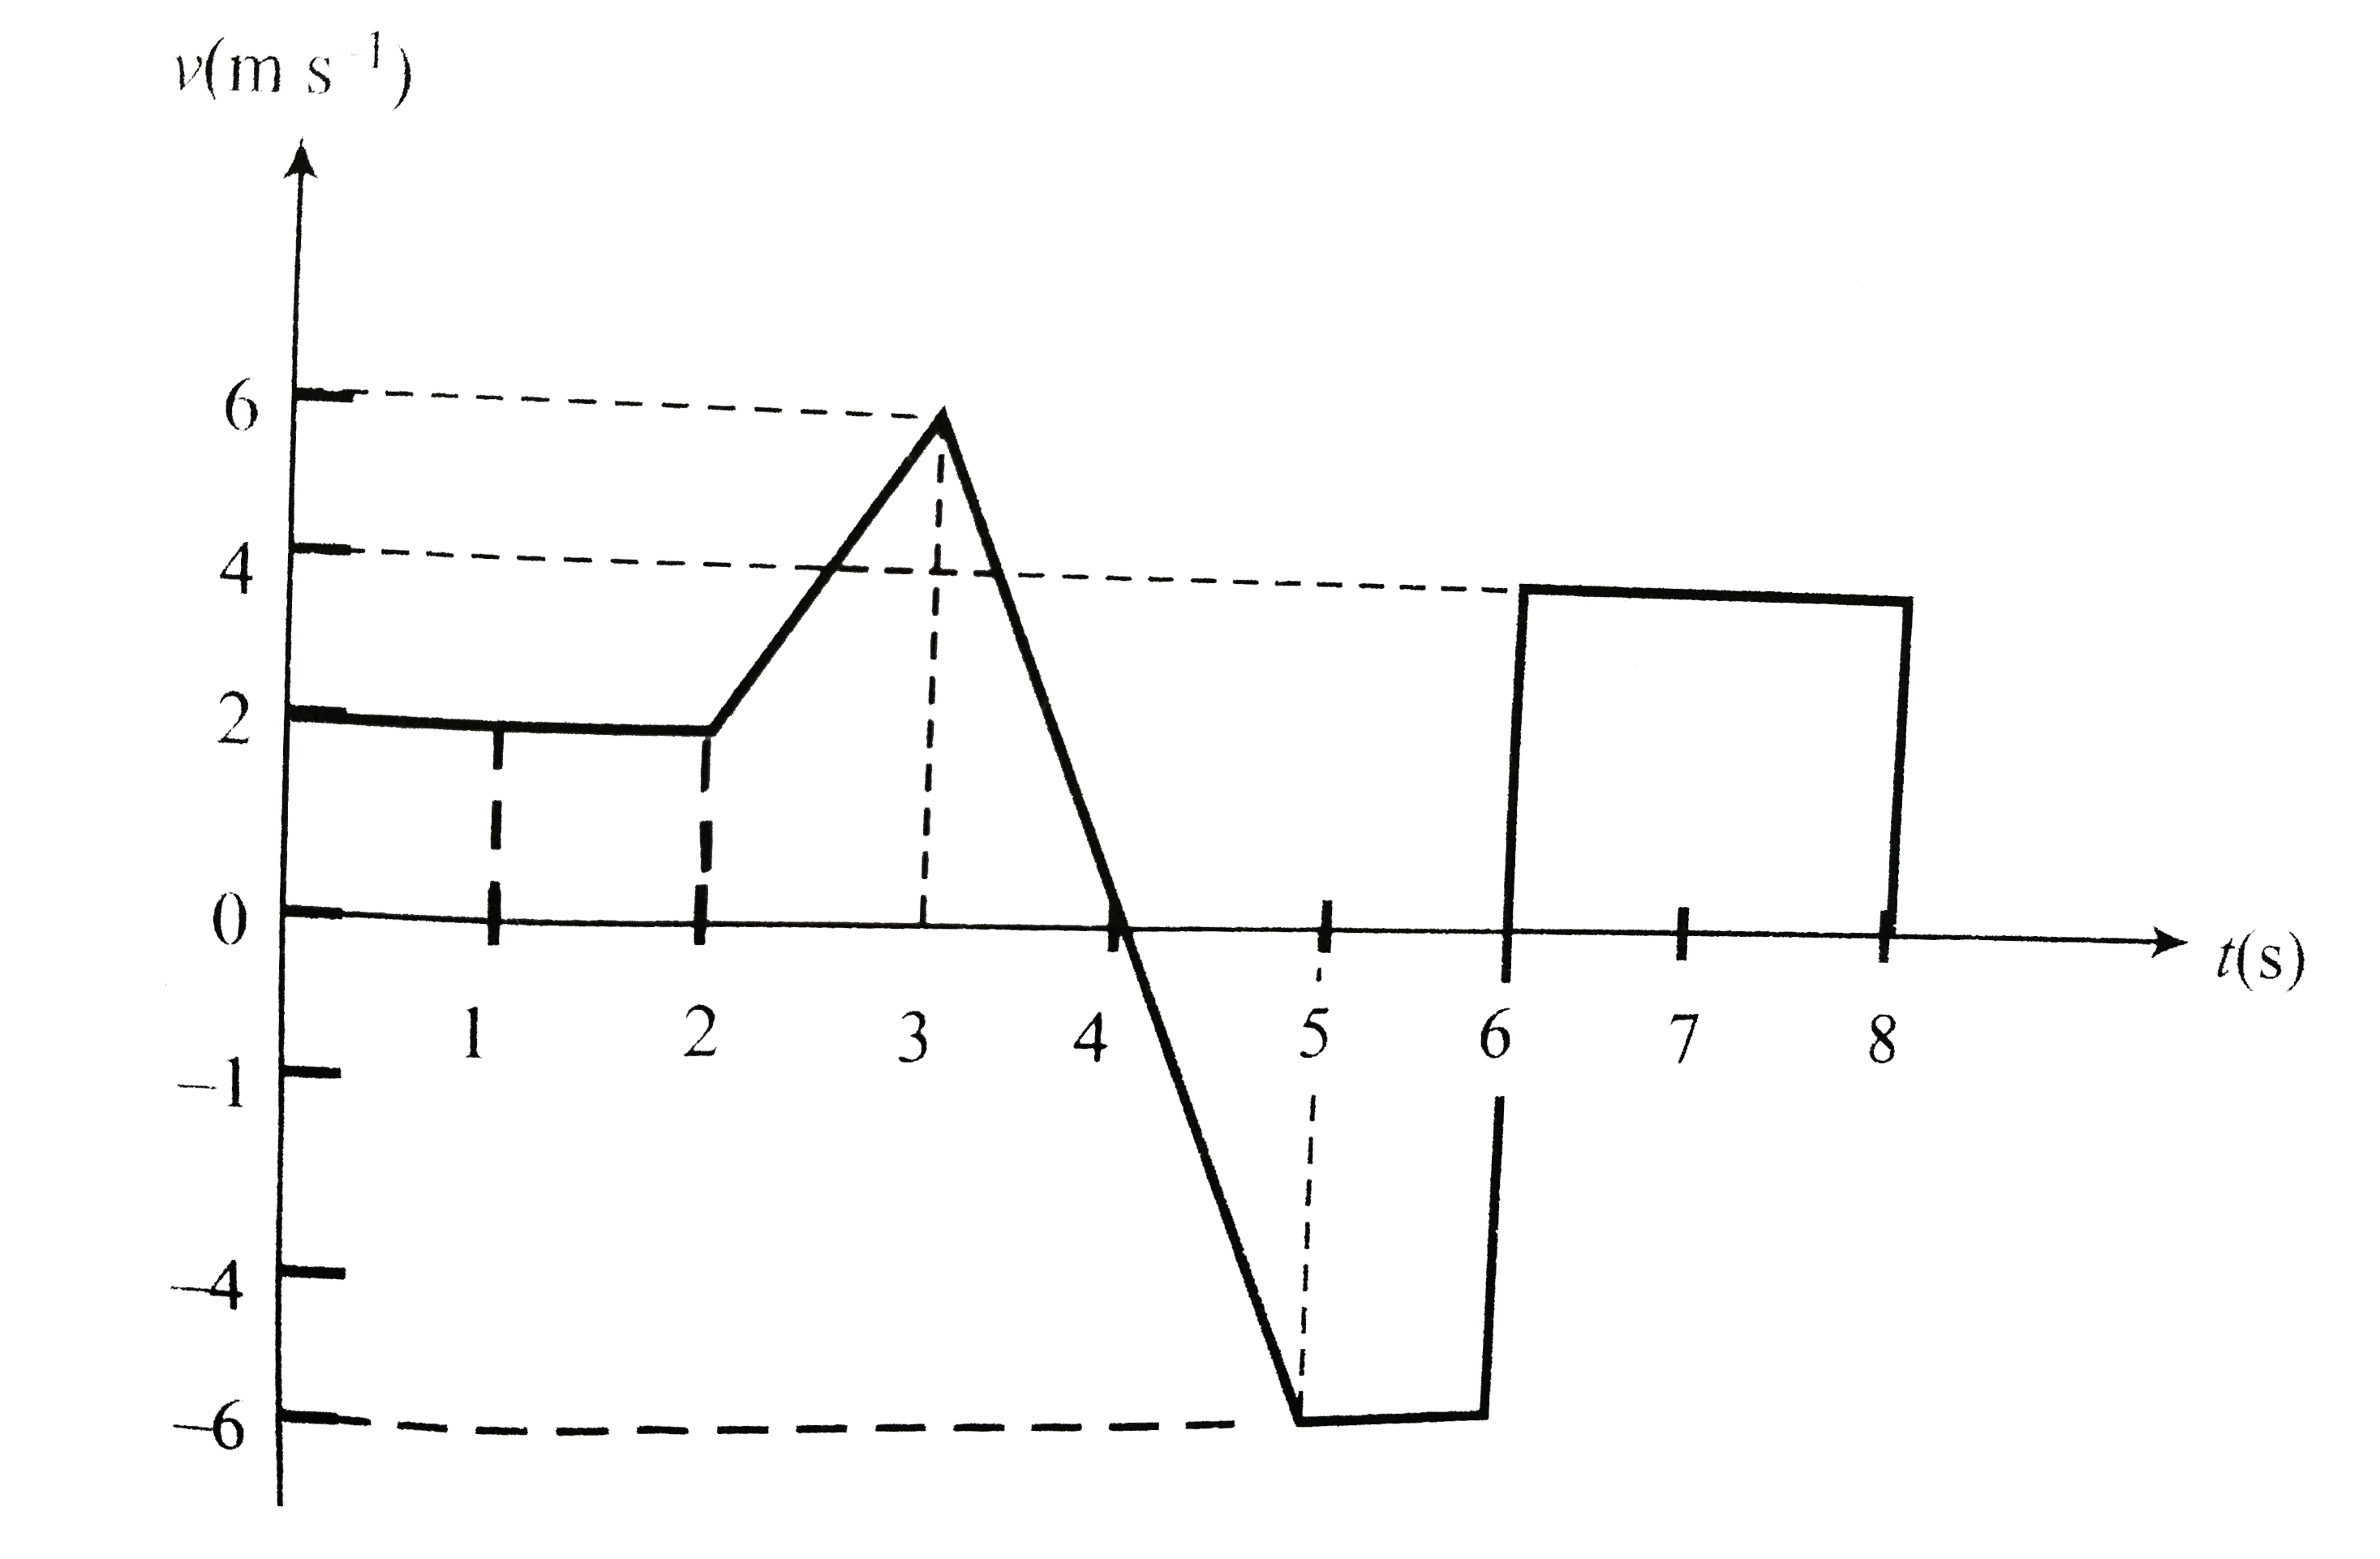
View SolutionThe velocity-time graph of a body is shown in .
The displacement of the body in 8s is.
 .View Solution
Draw the x-t graph of an object in uniform motion.
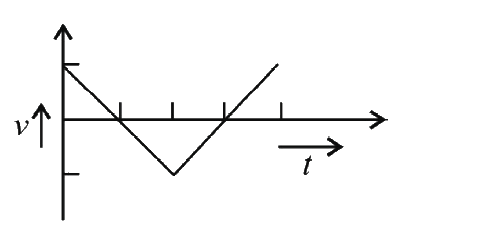
View SolutionThe graph in figure shows the velocity v versus time t for a body. Which of the graphs shown in figure represents the correesponding acceleration versus time graphs ?
 View Solution

