The curve obtained when percentage saturation of Hb with is plotted against is
J shaped
Rectangular hyperbola
Linear curve
Sigmoid curve
The correct Answer is:D
To solve the question regarding the curve obtained when the percentage saturation of hemoglobin (Hb) with oxygen (O2) is plotted against the partial pressure of O2 (pO2), we can follow these steps:
1. Understand the Variables:
- The x-axis will represent the partial pressure of oxygen (pO2).
- The y-axis will represent the percentage saturation of hemoglobin with oxygen.
2. Concept of Hemoglobin Saturation:
- Hemoglobin can bind to oxygen, and its saturation level indicates how much oxygen is bound to hemoglobin at various pressures of oxygen.
3. Plotting the Graph:
- As the partial pressure of O2 increases, the percentage saturation of hemoglobin also increases. Initially, at low pO2, the increase in saturation is slow.
4. Identify the Shape of the Curve:
- At low pO2, the curve rises slowly (low saturation).
- As pO2 increases, the curve steepens (high saturation).
- Eventually, as pO2 continues to rise, the curve levels off, indicating that hemoglobin is becoming fully saturated with oxygen.
5. Conclusion on the Type of Curve:
- The overall shape of the graph is sigmoidal (S-shaped). This is characteristic of cooperative binding, where the binding of one oxygen molecule increases the likelihood of additional oxygen molecules binding to hemoglobin.
6. Final Answer:
- The curve obtained when the percentage saturation of Hb with O2 is plotted against pO2 is a sigmoid curve.
- The x-axis will represent the partial pressure of oxygen (pO2).
- The y-axis will represent the percentage saturation of hemoglobin with oxygen.
- Hemoglobin can bind to oxygen, and its saturation level indicates how much oxygen is bound to hemoglobin at various pressures of oxygen.
- As the partial pressure of O2 increases, the percentage saturation of hemoglobin also increases. Initially, at low pO2, the increase in saturation is slow.
- At low pO2, the curve rises slowly (low saturation).
- As pO2 increases, the curve steepens (high saturation).
- Eventually, as pO2 continues to rise, the curve levels off, indicating that hemoglobin is becoming fully saturated with oxygen.
- The overall shape of the graph is sigmoidal (S-shaped). This is characteristic of cooperative binding, where the binding of one oxygen molecule increases the likelihood of additional oxygen molecules binding to hemoglobin.
- The curve obtained when the percentage saturation of Hb with O2 is plotted against pO2 is a sigmoid curve.
Topper's Solved these Questions
- BREATHING AND EXCHANGE OF GASES BOOK - AAKASH SERIESCHAPTER - BREATHING AND EXCHANGE OF GASES EXERCISE - EXERCISE-I (Regulation of Respiration)
15 Videos
- BREATHING AND EXCHANGE OF GASES BOOK - AAKASH SERIESCHAPTER - BREATHING AND EXCHANGE OF GASES EXERCISE - EXERCISE-I (Disorders of Respiratory System)
9 Videos
- BREATHING AND EXCHANGE OF GASES BOOK - AAKASH SERIESCHAPTER - BREATHING AND EXCHANGE OF GASES EXERCISE - EXERCISE-I (Exchange of Gases)
21 Videos
- BODY FLUIDS AND CIRCULATIONBOOK - AAKASH SERIESCHAPTER - BODY FLUIDS AND CIRCULATIONEXERCISE - Exercise -III (Previous AIPMT/NEET Questions)
35 Videos
- CHEMICAL COORDINATION AND INTERGRATIONBOOK - AAKASH SERIESCHAPTER - CHEMICAL COORDINATION AND INTERGRATIONEXERCISE - Exercise-III (previous AIPMT/NEET questions)
41 Videos
Similar Questions
Knowledge Check
Assertion : A sigmoid curve is obtained when percentage saturation of haemoglobin with O2 is plotted against the PO2.
Reason : Every 100 mL of oxygenated blood can deliver around 5mL of O2 to the tissues under normal physiological conditions.AIf both assertion and reason are true and reason is the correct explanation of assertionBIf both assertion and reason are true and reason is not the correct explanation of assertionCIf assertion is true but reason is false.DIf both assertion and reason are false.
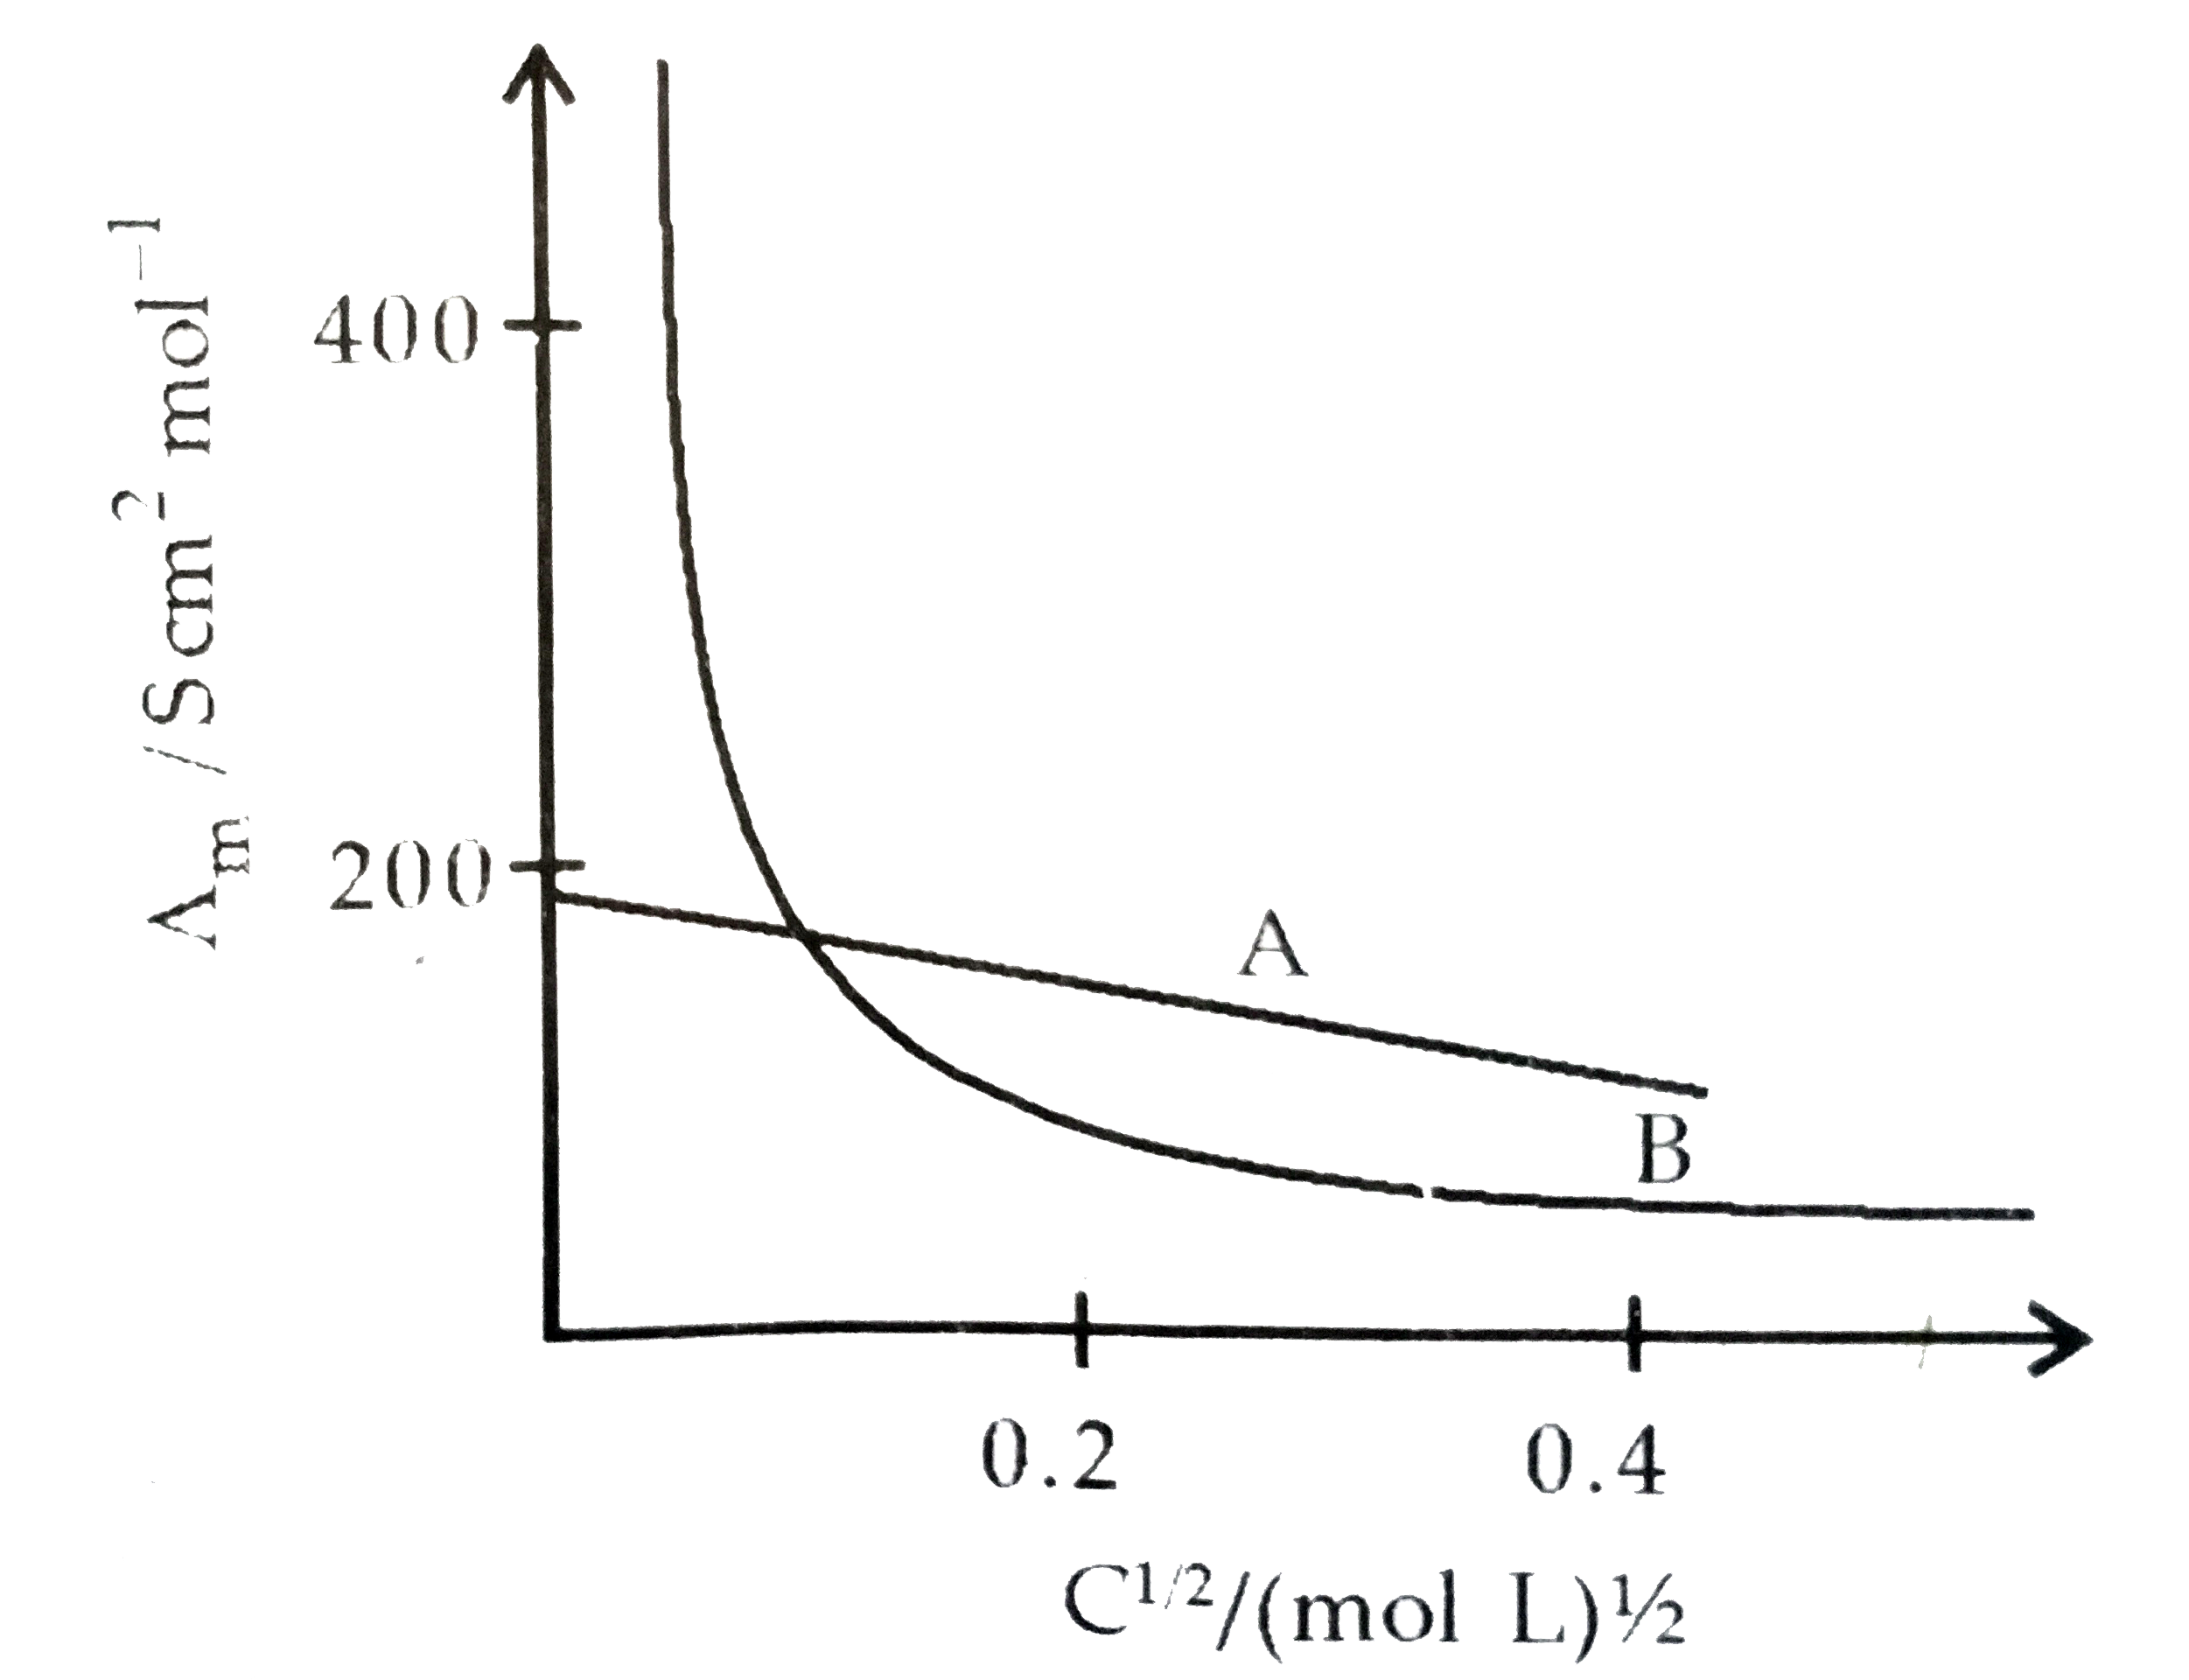
The following curve is obtained when molar conductivity (∧m) is plotted against the square root of concentration, c1/2 for two electrolytes A and B
(a) How do you account for the increase in the molar conductivity of the electrolyte A on dilution.

(b) As seen from the graph, the value of limiting molar conductivity (∧0m) for electrolyte B cannot be obtained graphically. How can this value be obtained?1
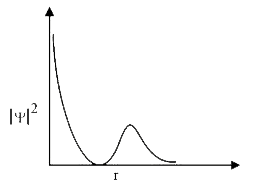
View SolutionThe graph for an orbital between |φ|2 and r(radial distance) is shown below. The sum of principle quantum number, azimuthal, quantum number and magnetic quantum number of this orbital is ____________.

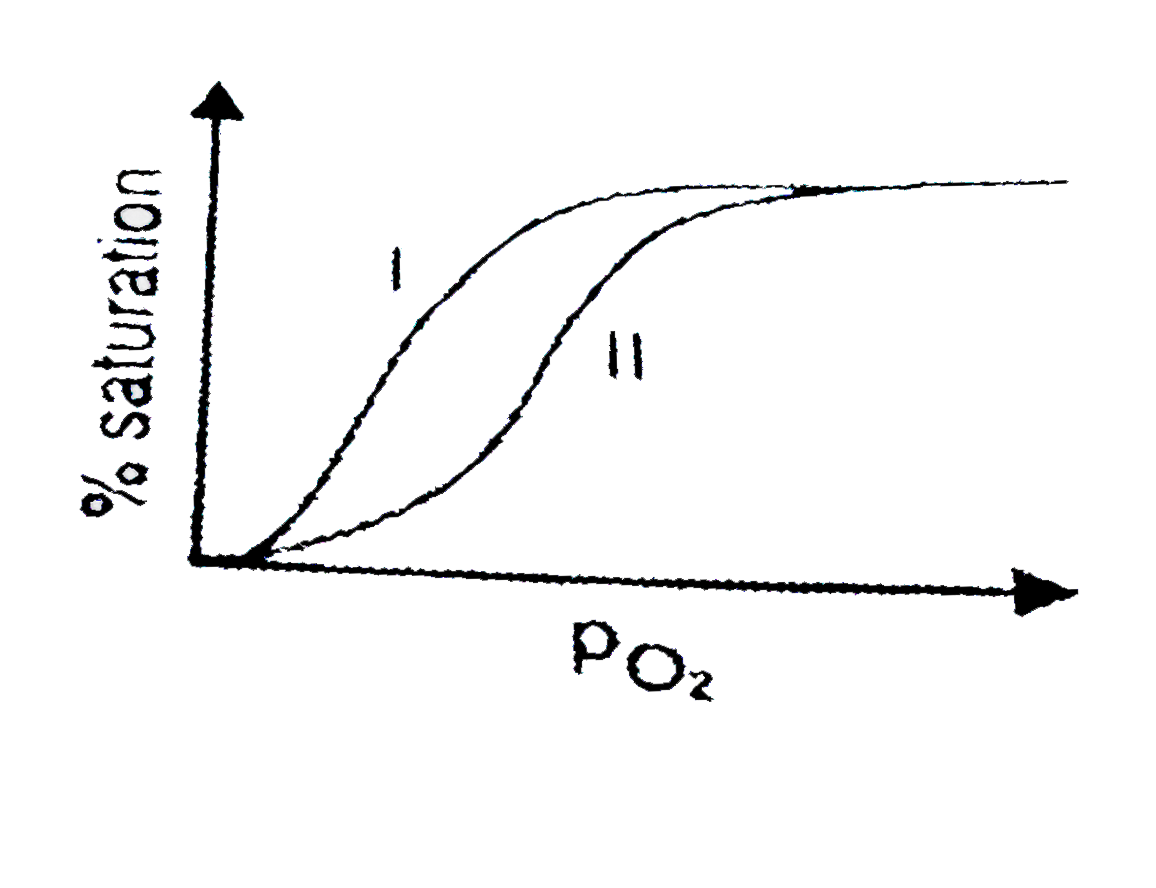
View SolutionHaemoblobin is a Fe containing protein responsible for oxygen transport in the blood. The curves given below indicate the percentage suturation of haemoglobin by O2 as a funcion of partial pressure of O2.
Which of the following statement/s is/are correct for the given curves?
I. In presence of CO2, higher PO2 is needed for a given percentage saturation.
II. In presence of CO2, lower PO2 is needed for a give percentage saturation.
III. The maximum percentgae saturation is not affected by the presence of CO2
IV. In the absence of CO2, maximum saturation of haemoglobin occurs at lower pO2.

View SolutionThe percentage of H2O in CuSO45H2O is
View SolutionThe percentage amount of CO2 carried or transported by Hb is
View Solutionthe percentage strength of 10 volume H2O2 solution is nearly
View SolutionWhich is not obtained when metal carbides react with H2O?
View Solution
