The Shape of growth curve obtained when the length of an organ is plotted against the time is
Parabola
S' Shape
Linear
Step wise
The correct Answer is:C
To answer the question regarding the shape of the growth curve obtained when the length of an organ is plotted against time, we can follow these steps:
1. Understanding Growth Curves: A growth curve is a graphical representation that shows how a particular quantity, such as the length of an organ, increases over time.
2. Identifying the Shape: When we plot the length of an organ against time, we observe that the growth does not occur at a constant rate. Instead, it typically follows a specific pattern.
3. Recognizing the Sigmoid Curve: The growth curve for many biological systems, including plant growth, often takes the shape of an "S" or sigmoid curve. This curve represents three phases of growth: lag phase, exponential growth phase, and a plateau phase.
4. Eliminating Incorrect Options:
- Parabola: This shape represents quadratic growth, which is not applicable in this context.
- Linear: This would imply constant growth, which does not accurately reflect biological growth patterns.
- Step-wise: This suggests abrupt changes in growth, which is also not characteristic of the typical growth pattern.
5. Conclusion: Therefore, the correct answer is that the shape of the growth curve obtained when the length of an organ is plotted against time is a sigmoid curve.
Final Answer:
The shape of the growth curve obtained when the length of an organ is plotted against time is a sigmoid curve (option B).
---
- Parabola: This shape represents quadratic growth, which is not applicable in this context.
- Linear: This would imply constant growth, which does not accurately reflect biological growth patterns.
- Step-wise: This suggests abrupt changes in growth, which is also not characteristic of the typical growth pattern.
The shape of the growth curve obtained when the length of an organ is plotted against time is a sigmoid curve (option B).
Topper's Solved these Questions
- PLANT GROWTH AND DEVELOPMENT BOOK - AAKASH SERIESCHAPTER - PLANT GROWTH AND DEVELOPMENT EXERCISE - EXERCISE - I (PLANT GROWTH REGULARTORS - GENERAL )
12 Videos
- PLANT GROWTH AND DEVELOPMENT BOOK - AAKASH SERIESCHAPTER - PLANT GROWTH AND DEVELOPMENT EXERCISE - EXERCISE - I (AUXINS )
15 Videos
- PHOTOSYNTHESIS IN HIGHER PLANTS BOOK - AAKASH SERIESCHAPTER - PHOTOSYNTHESIS IN HIGHER PLANTS EXERCISE - Exercise - III
27 Videos
- PRINCIPLES AND PROCESSES BOOK - AAKASH SERIESCHAPTER - PRINCIPLES AND PROCESSES EXERCISE - Exercise - III (Previous AIPMT/NEET Questions)
26 Videos
Similar Questions
The J-shaped growth curve lacks
View SolutionGrowth plotted against time gives a
View SolutionThe shape of the curve obtained when substrate concentration is plotted against velocity of reaction
View SolutionThe curve obtained when percentage saturation of Hb with O2 is plotted against pO2 is
View SolutionS - shaped growth curve is formed in :
View SolutionA J-shaped growth curve depicts
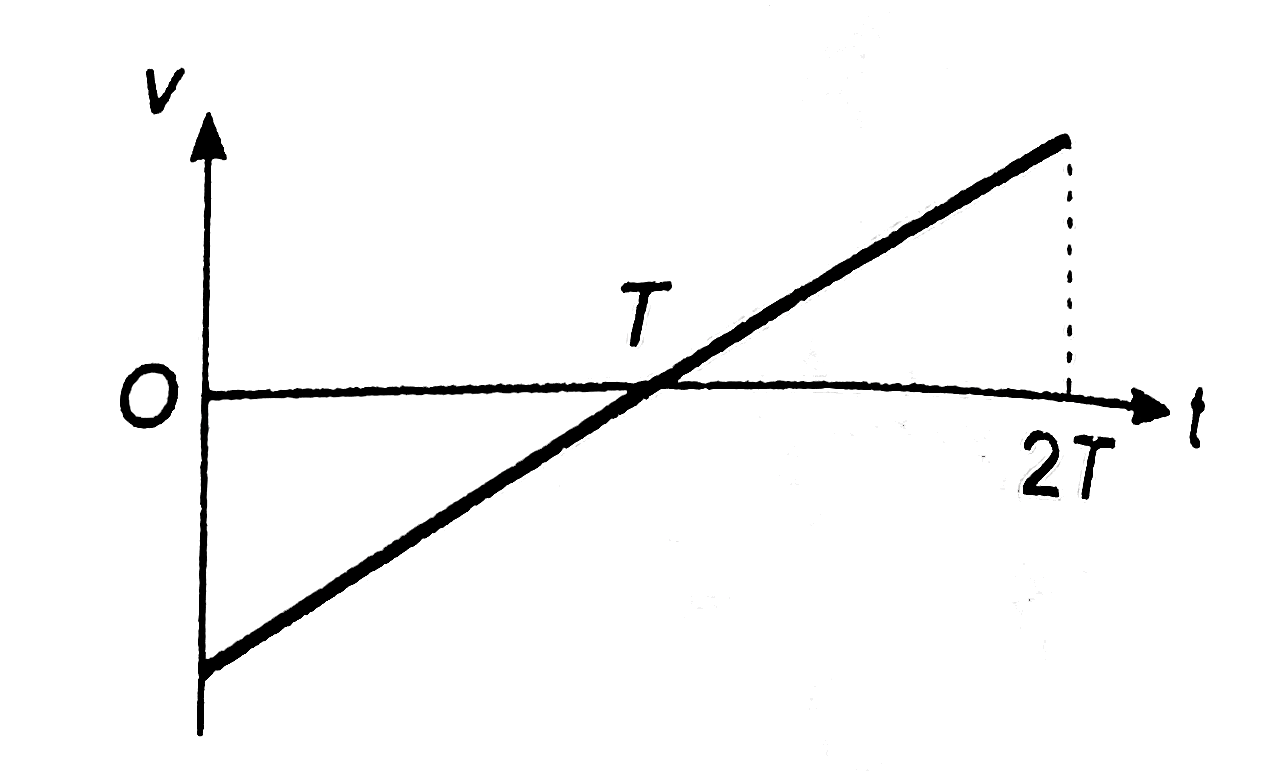
View SolutionThe figure shows the velocity (v) of a particle plotted against time (t).

View SolutionThe figure shows the velocity (v) of a particle plotted against time (t).

View SolutionThe growth curve of bacterial population is lab is plotted against time. What will be the shape of graph ?
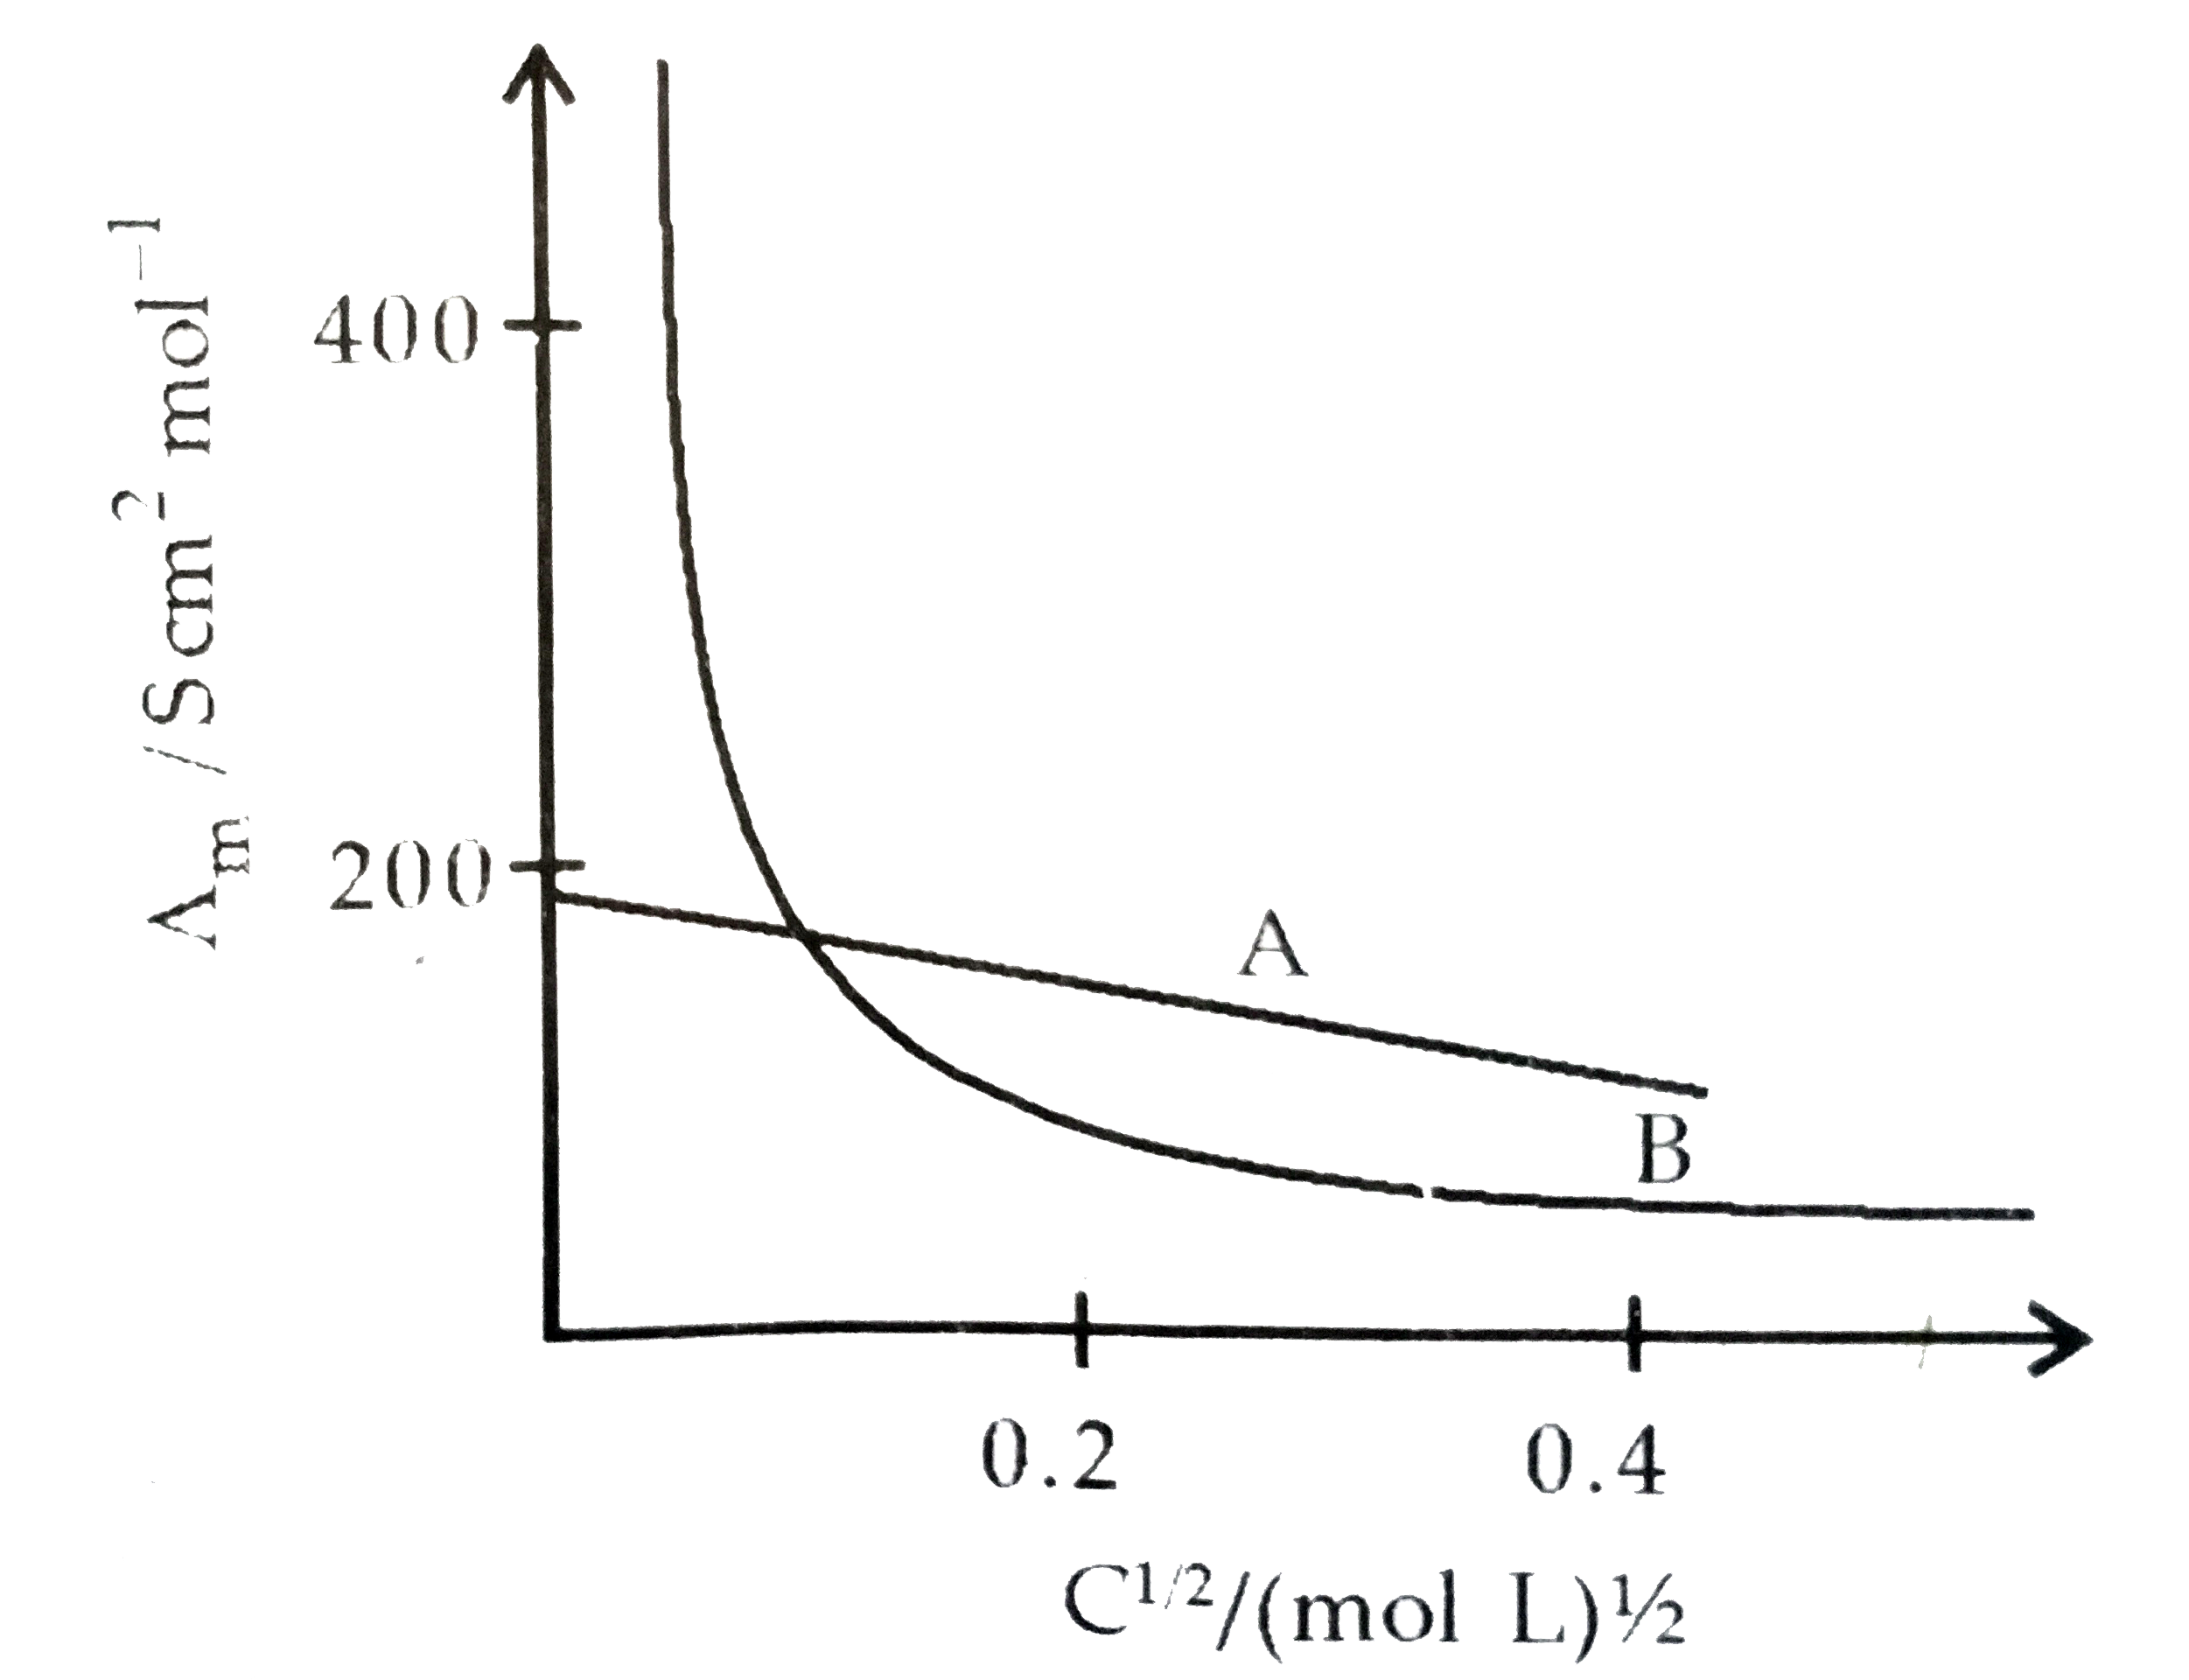
View SolutionThe following curve is obtained when molar conductivity (∧m) is plotted against the square root of concentration, c1/2 for two electrolytes A and B
(a) How do you account for the increase in the molar conductivity of the electrolyte A on dilution.

(b) As seen from the graph, the value of limiting molar conductivity (∧0m) for electrolyte B cannot be obtained graphically. How can this value be obtained?1
View Solution
