A ecological pyramid, devised by C. Elton 1927 is a graphic diagram that shows relationship between
Transfer of food through food chains
Organisms
Various trophic levels of a food chain
Populations and communities within an ecosystem
The correct Answer is:C
Step by step video & image solution for A ecological pyramid, devised by C. Elton 1927 is a graphic diagram that shows relationship between by Biology experts to help you in doubts & scoring excellent marks in Class 11 exams.
Updated on:21/07/2023Topper's Solved these Questions
- ECOSYSTEMBOOK - AAKASH SERIESCHAPTER - ECOSYSTEMEXERCISE - EXERCISE-I (PLANT SUCCESSION )
26 Videos
- ECOSYSTEMBOOK - AAKASH SERIESCHAPTER - ECOSYSTEMEXERCISE - EXERCISE-I (NUTRIENT CYCLING)
27 Videos
- ECOSYSTEMBOOK - AAKASH SERIESCHAPTER - ECOSYSTEMEXERCISE - EXERCISE-I (TROPHIC LEVELS AND FOOD CHAINS )
21 Videos
- CELL CYCLE AND CELL DIVISIONBOOK - AAKASH SERIESCHAPTER - CELL CYCLE AND CELL DIVISIONEXERCISE - Exercise-III
18 Videos
- ENVIRONMENTAL ISSUESBOOK - AAKASH SERIESCHAPTER - ENVIRONMENTAL ISSUESEXERCISE - Exercise-III (Previous AIPMT/NEET Questions)
41 Videos
Similar Questions
Knowledge Check

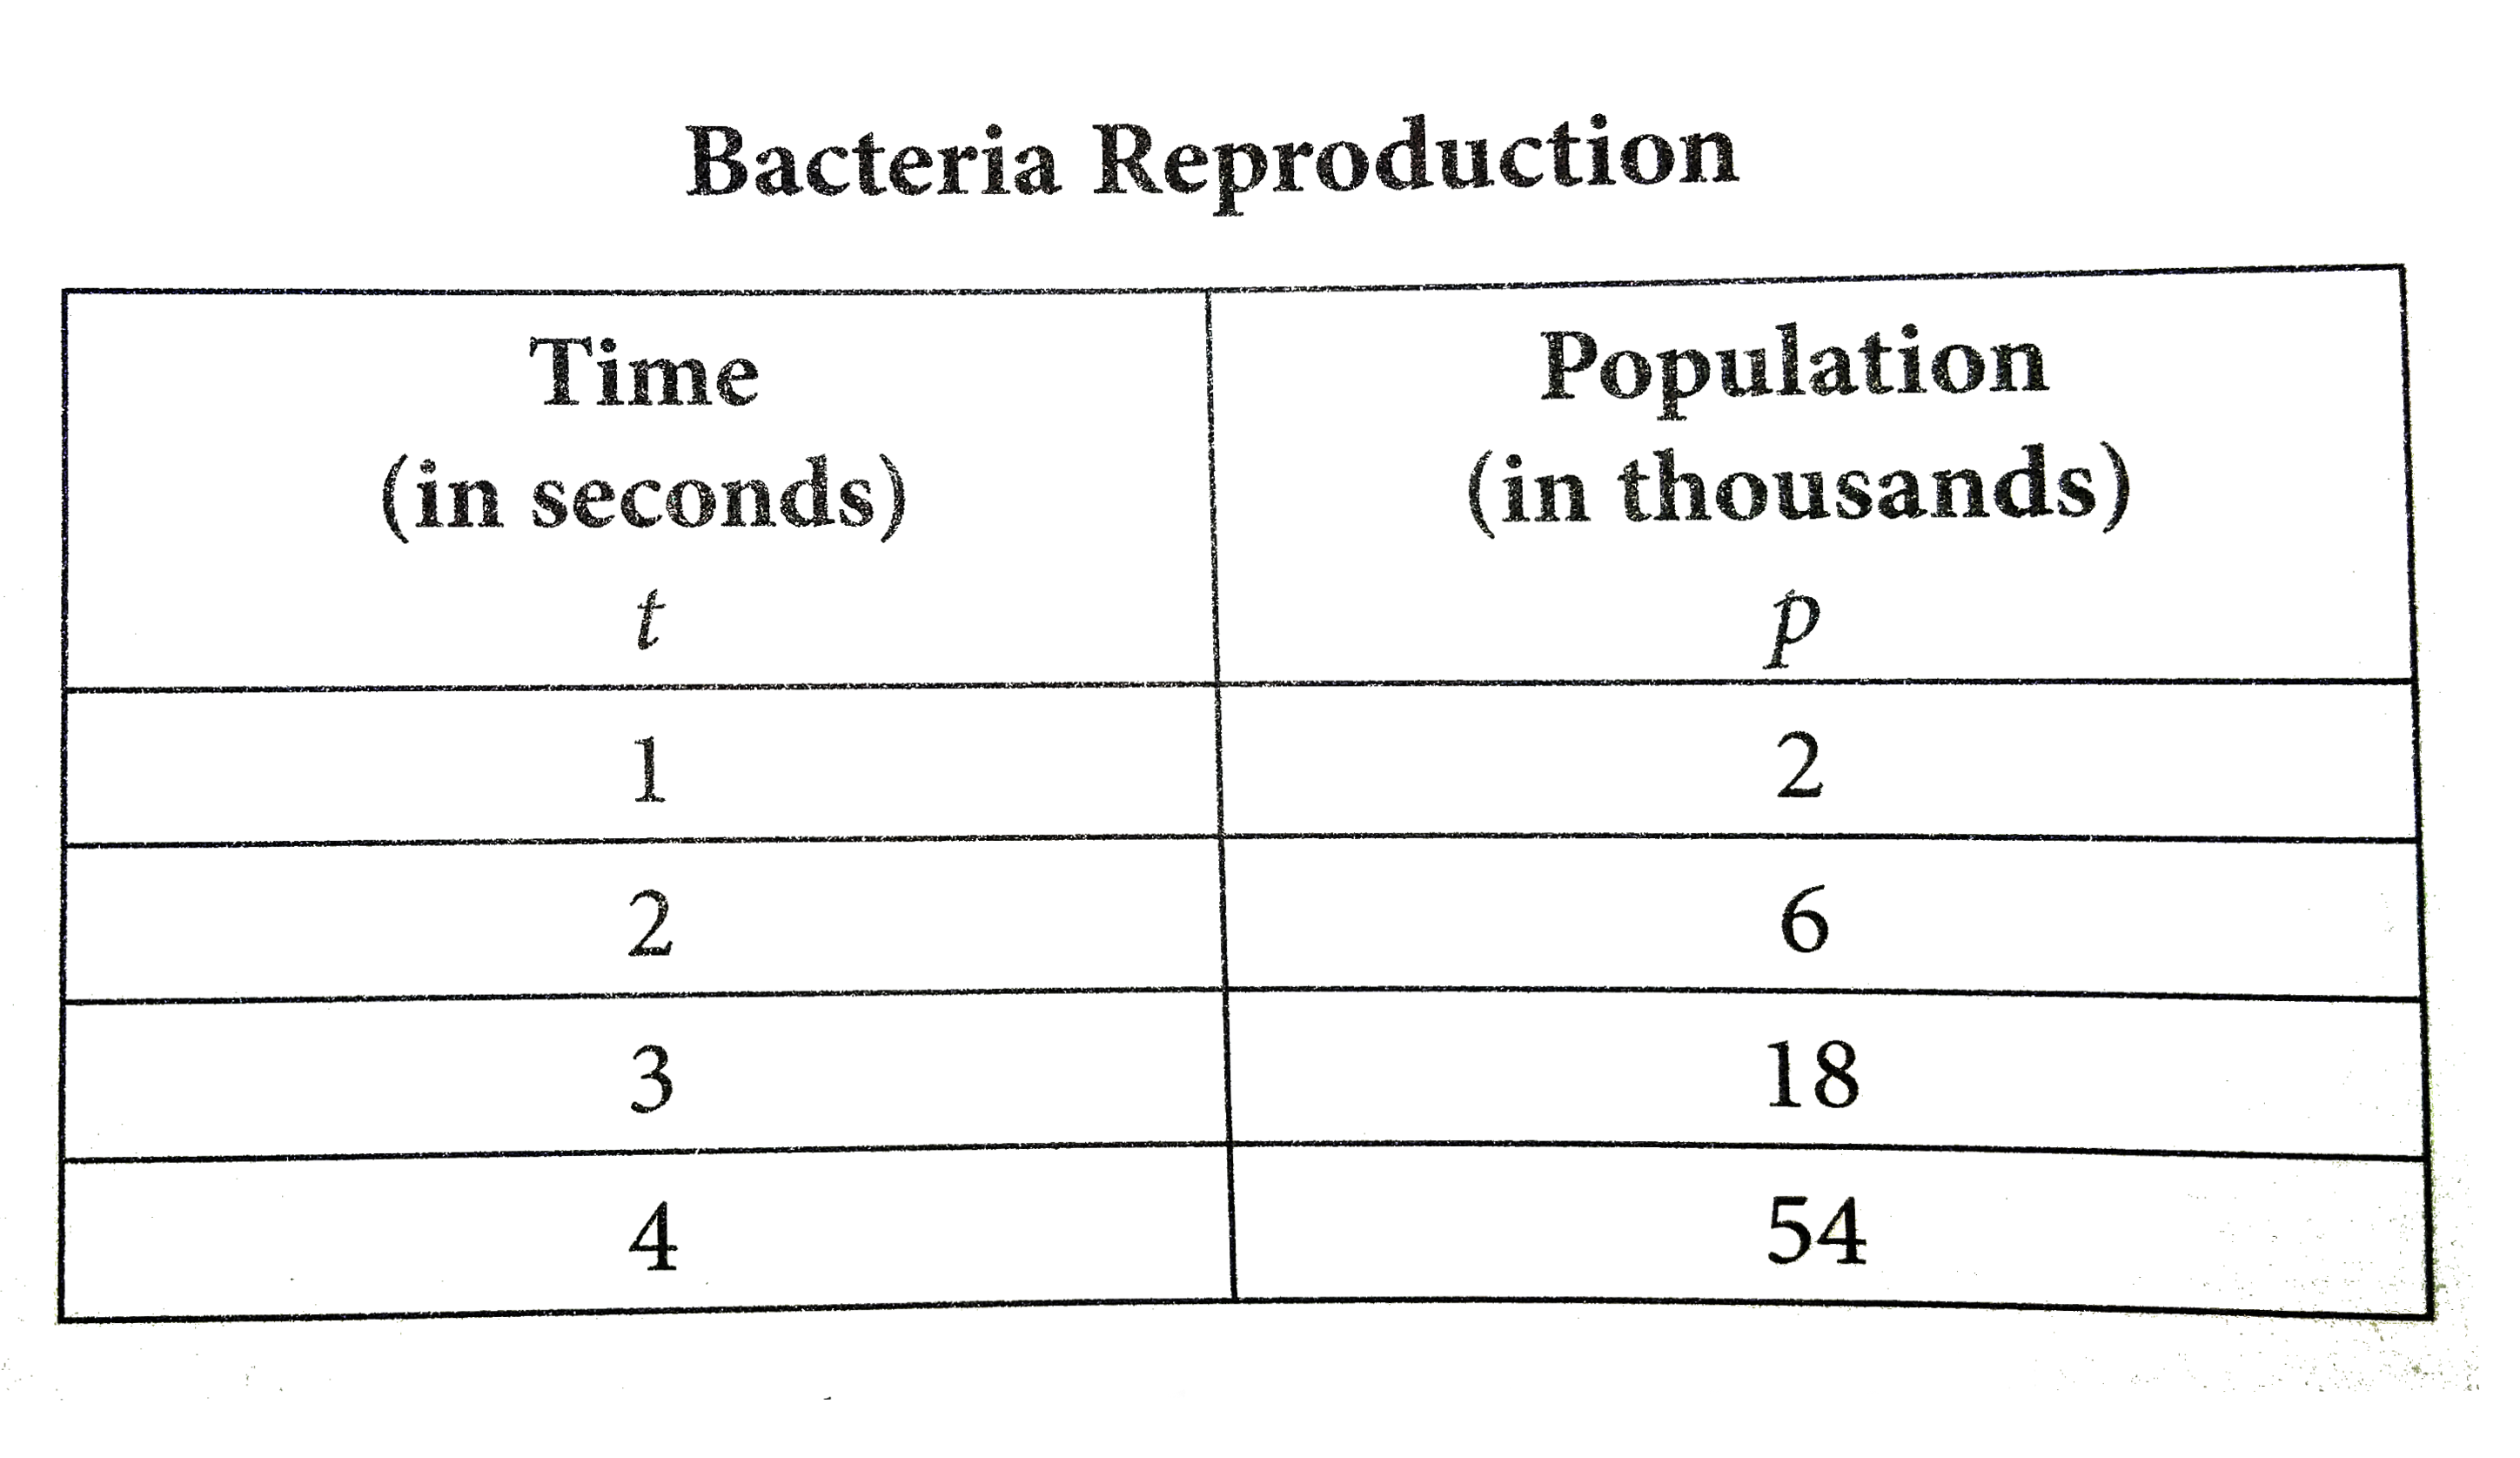
The table above shows the population growth of certain bacteria over four seconds. Which one of the following equations shows the relationship between t and p, according to the table?Ap=3tBp=2t2Cp=2×3tDp=2×3t−1
Given, ζ={x:x∈N,12≤x≤20}
A={x:x is divisible by 3} and B={12,14,15,16}
Draw a Venn-diagram to show the relationship between the given sets.
View SolutionTwo sets A and B are such that A∩B=π. Draw a Venn-diagram to show the relationship between A and B. Shade the region representing :
(i) A∪B, (ii) (A∪B)', (iii) B-A, (iv) B∩A'
View SolutionEstablish a relationship between CvandCp?
View SolutionA curve drawn at constant temperature is called an isotherm. This shows the relationship between :
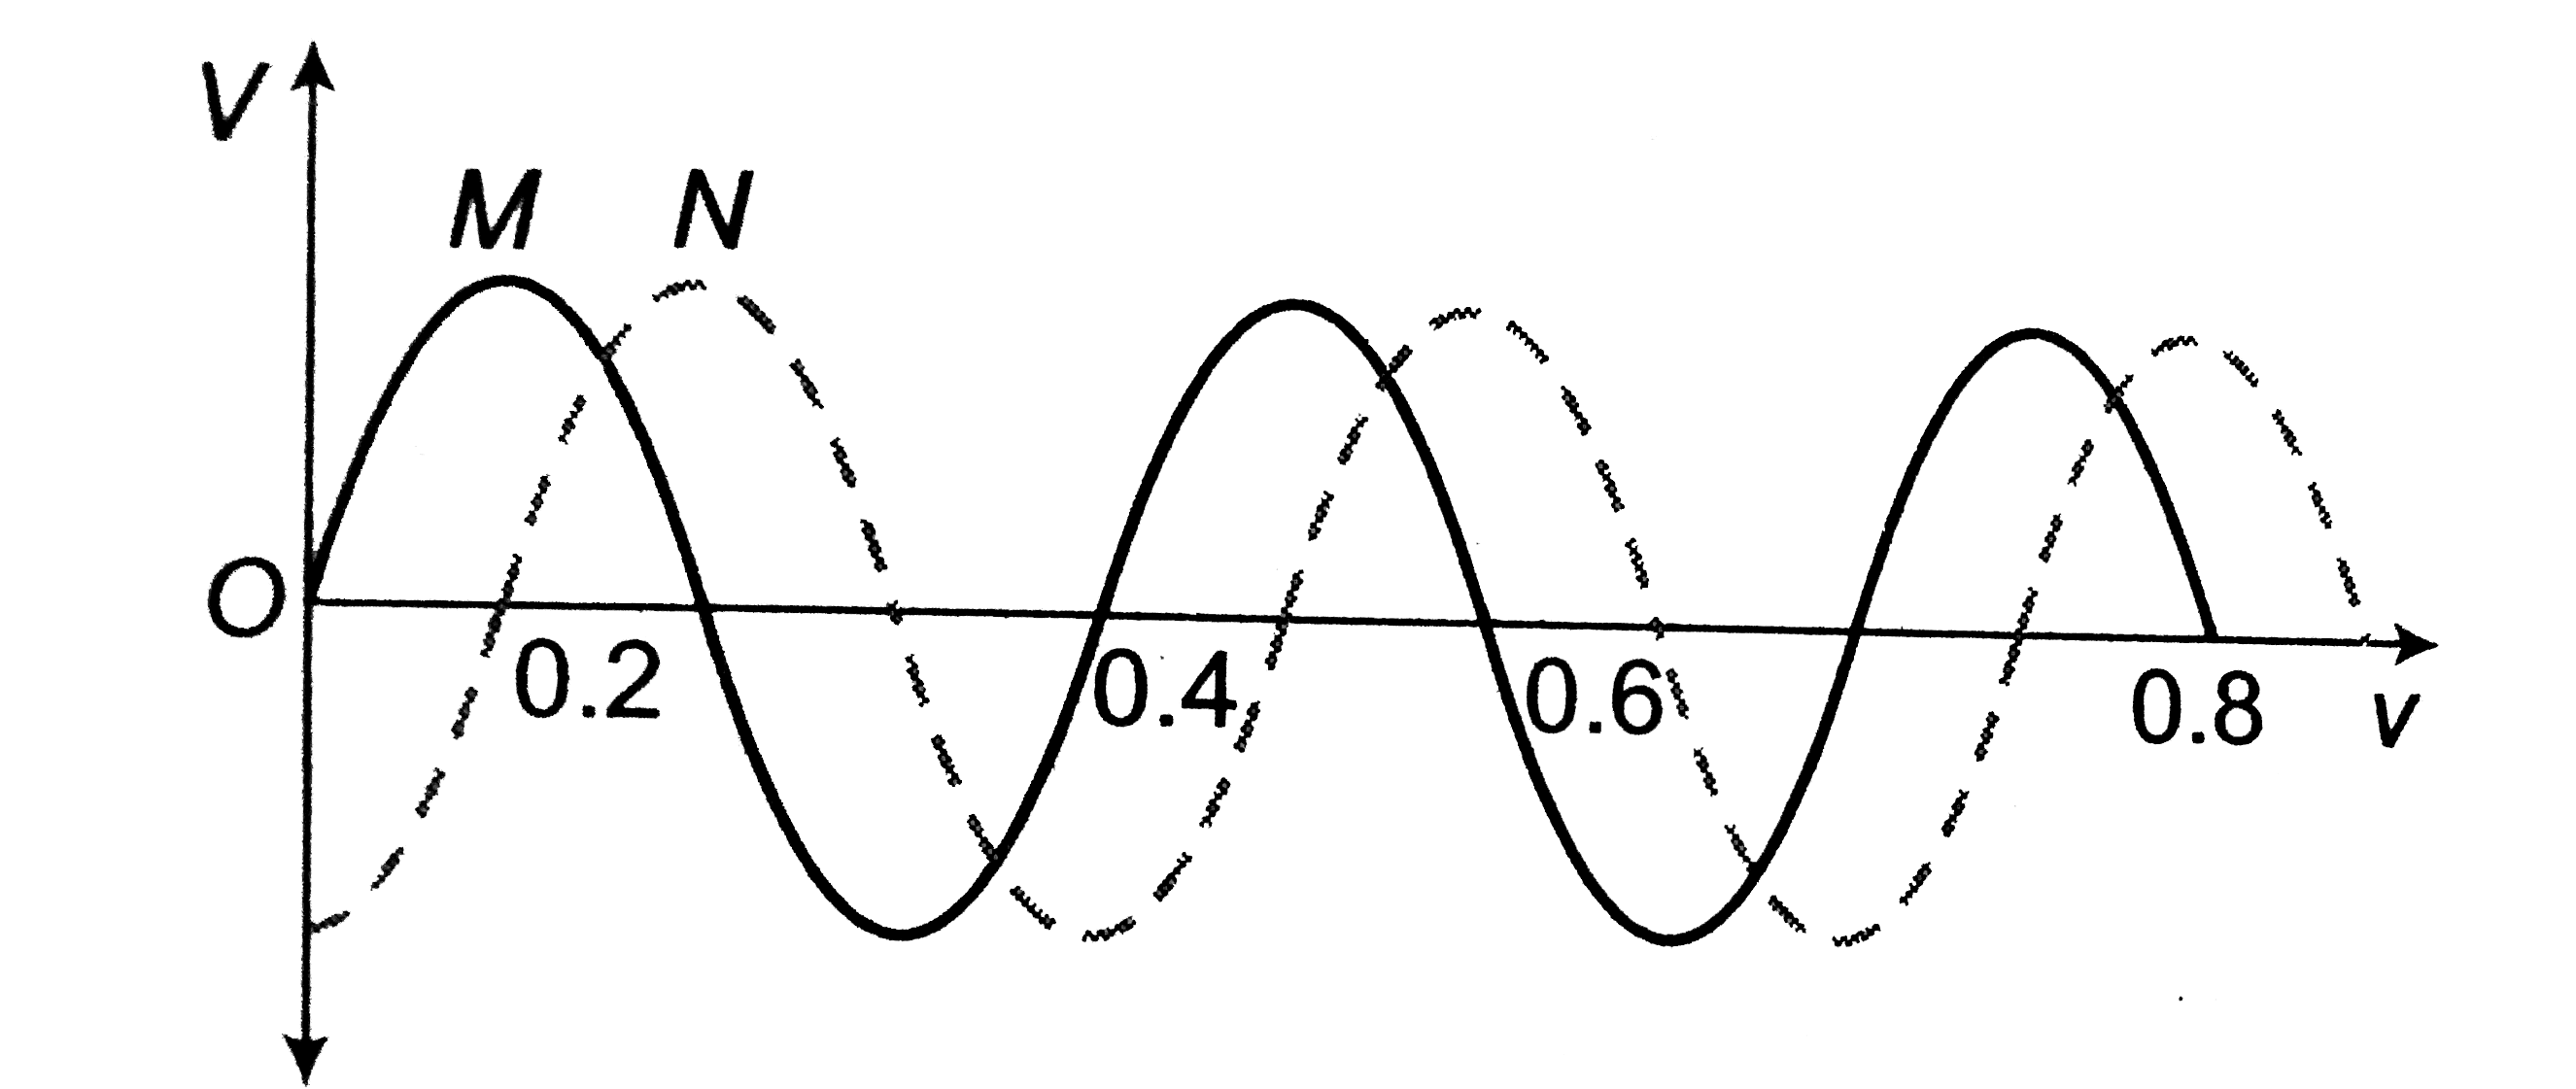
View SolutionTwo sinusoidal voltage of the same frequency are shown in the diagram. What is the frequency, and the phase relationship between the voltage?

Frequency in Hz phase lead of N over M in radius
View SolutionTwo sinusoidal voltage of the same frequency are shown in the diagram. What is the frequency, and the phase relationship between the voltage? Frequency in Hz phase lead of N over M in radius .

View SolutionWhat do you understand by KpandKc ? Derive a relationship between the two.
View Solution
