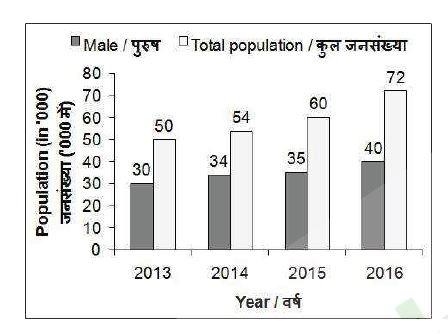
The bar graph given below represents the total propulation and male population (in 000) of a city, during the period of 2013 to 2016.
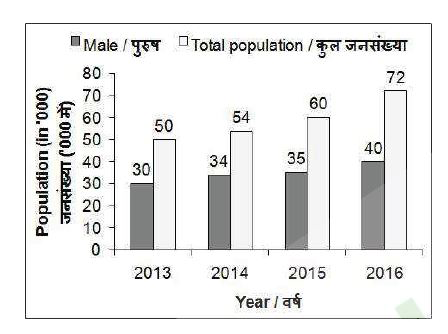
What is the ratio of male and female population respectively in 2015?
The correct Answer is:C
Step by step video, text & image solution for The bar graph given below represents the total propulation and male population (in 000) of a city, during the period of 2013 to 2016. What is the ratio of male and female population respectively in 2015? by Maths experts to help you in doubts & scoring excellent marks in Class 14 exams.
Similar Questions
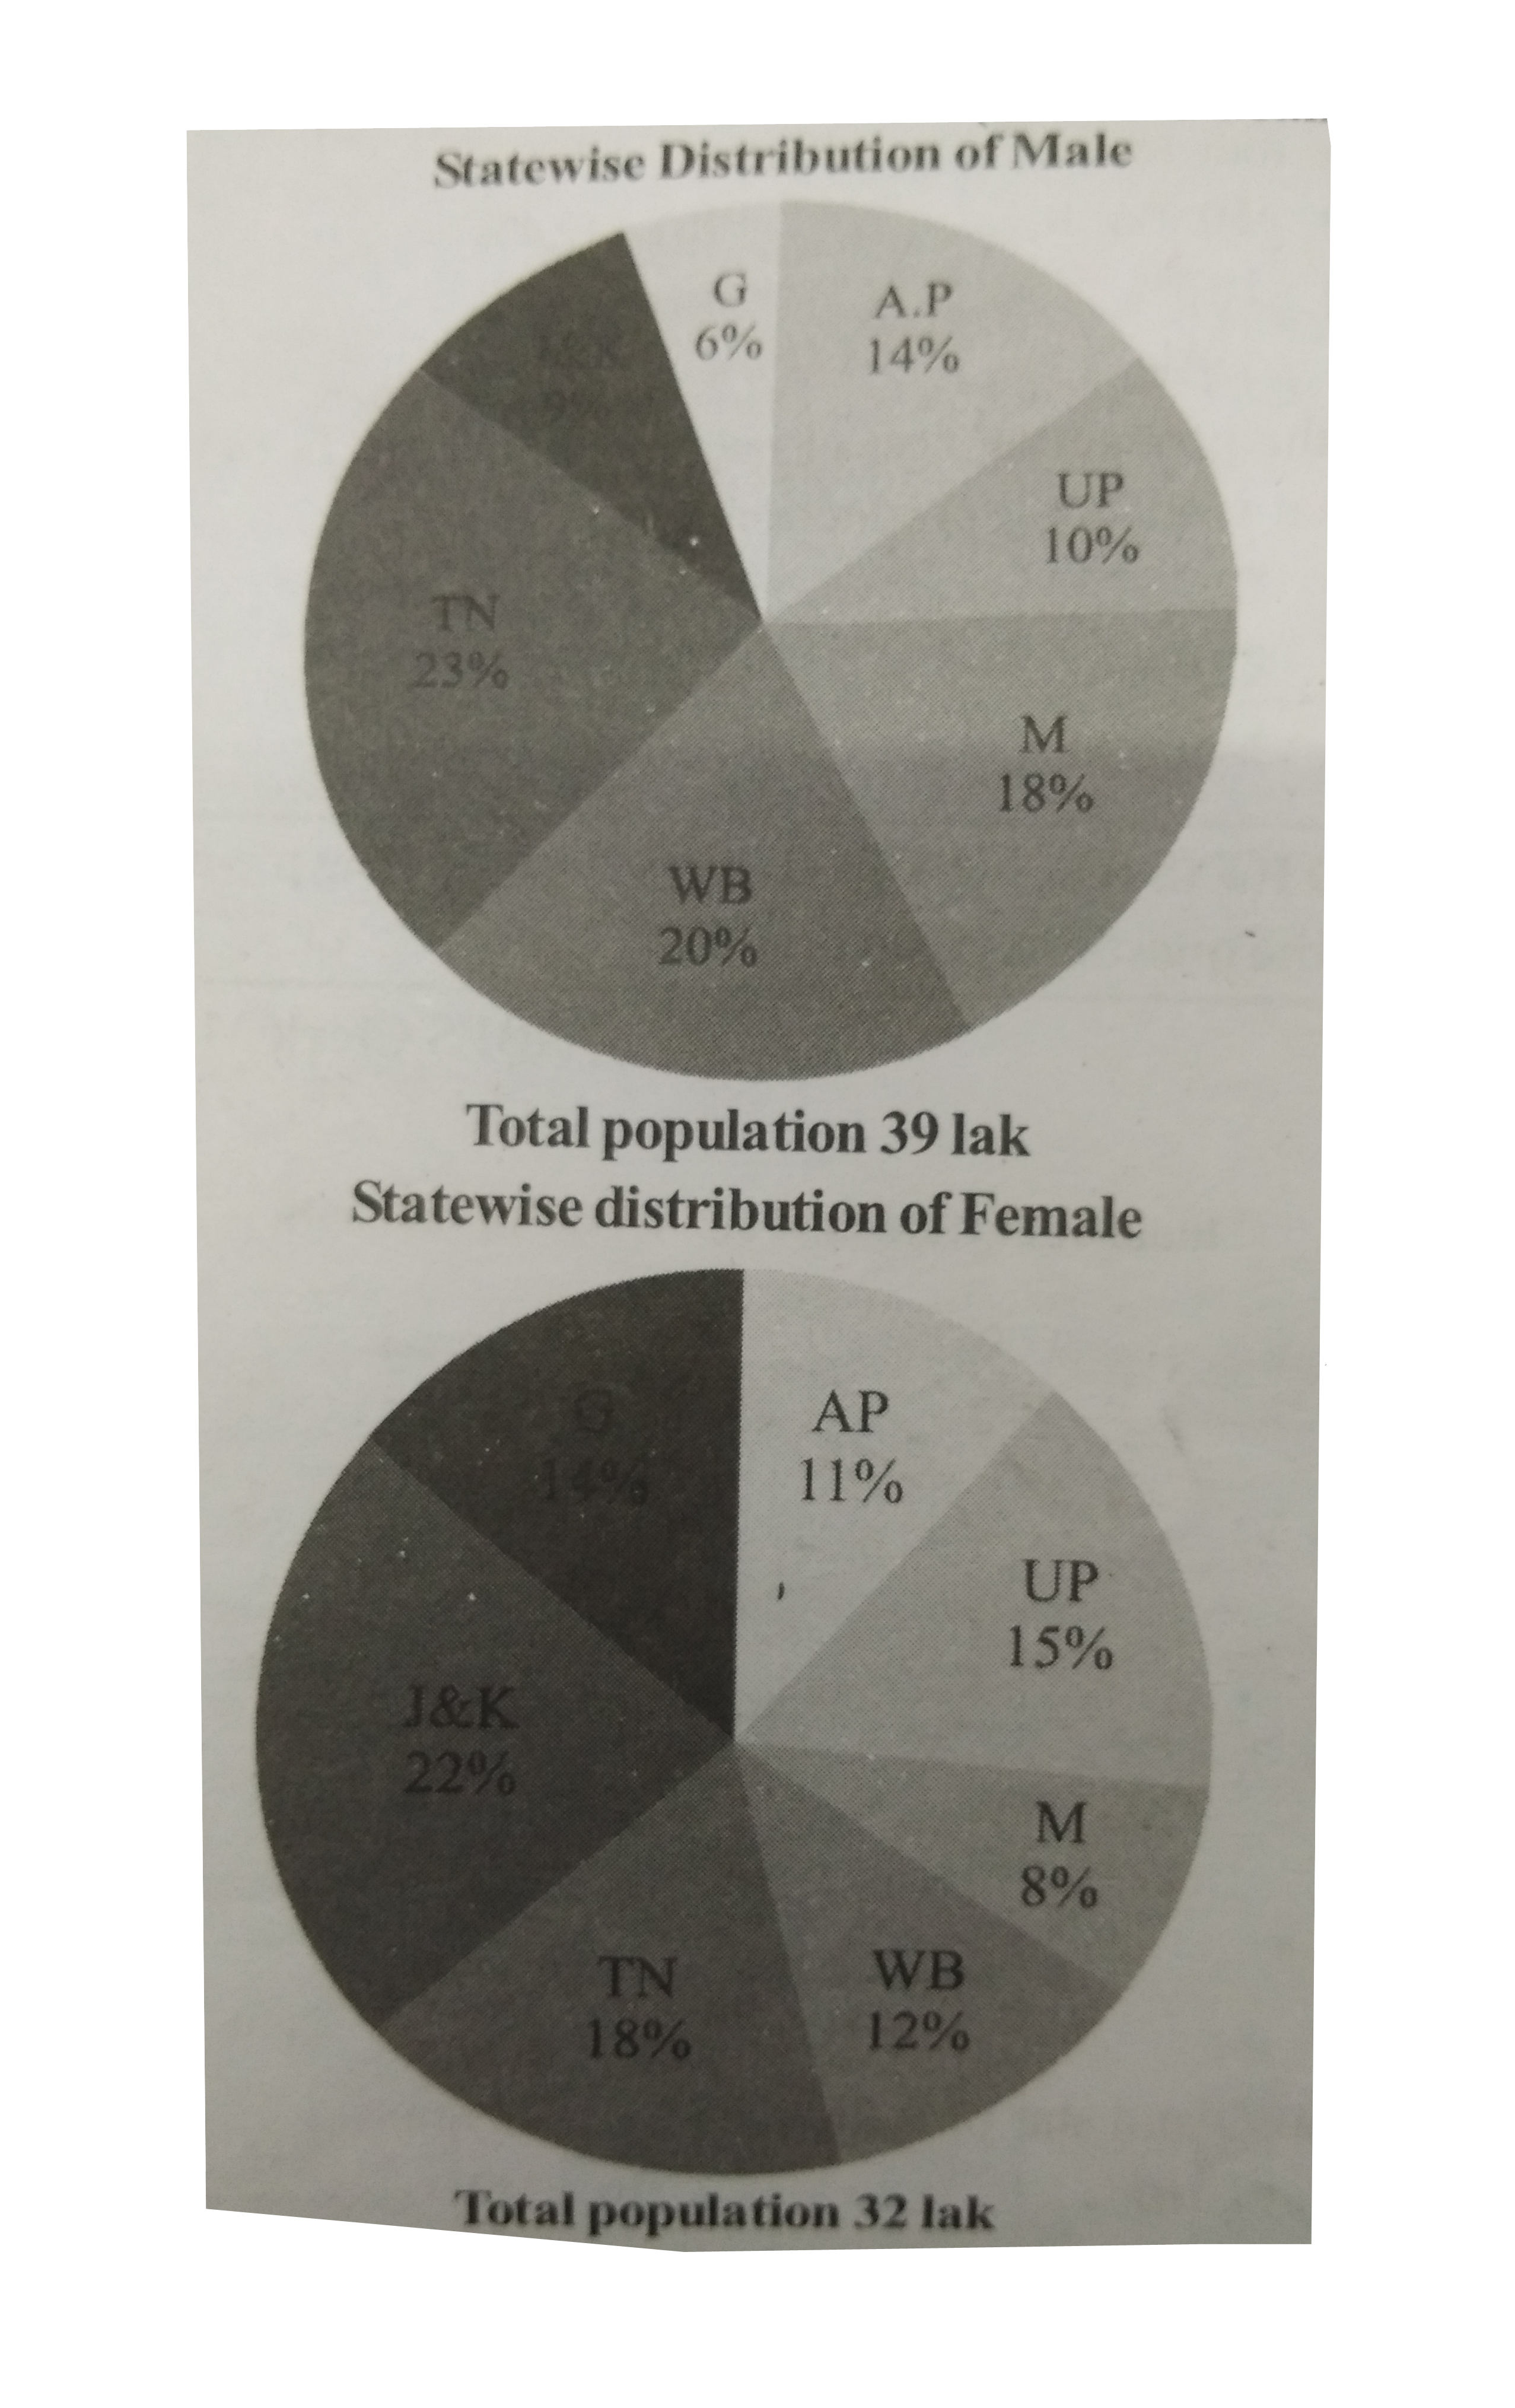
What is the rati between the Female population of state UP and the male population of M ?View SolutionThe bar graph given below represents the number of players of a college taking part in three games for 3 years.
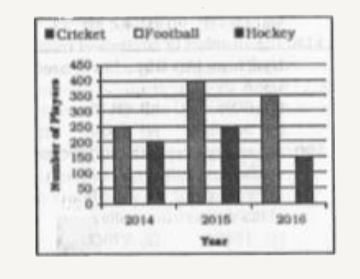
Total number of players in 2015 is what percent of total number of players in 2016?View Solution
Knowledge Check
- Question 1 - Select One
The bar graph given below represents the total population and male population (in '000) of a city, during to period of 2013 to 2016.
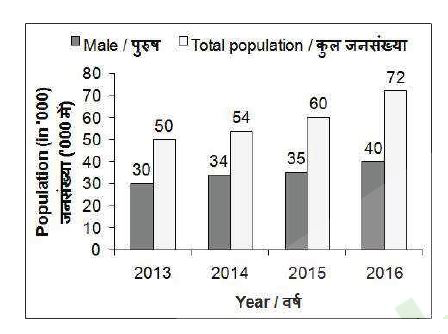
Female population in 2015 is what percent of female population in 2014?A25B80C150D125 - Question 2 - Select One
The bar graph given below represents the total population and male population (in '000) of a city, during to period of 2013 to 2016.
In 2014 female population is what percent of total population?A62.96B37.03C20D31.13 - Question 3 - Select One
The bar graph given below represents the total population and male population (in 000) of a city, during the period of 2013 to 2016 .
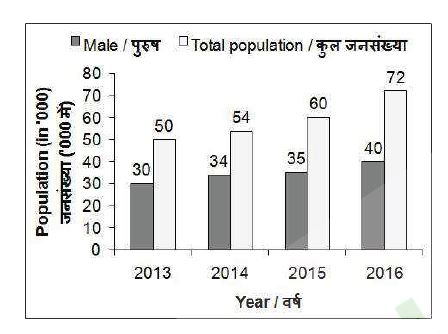
In 2016 male population is how much percent more than the female population?A25B20C23D28
Average female to male ratio in world population is
View SolutionThe Bar graph given below presents the number of males and females working in five different companies.
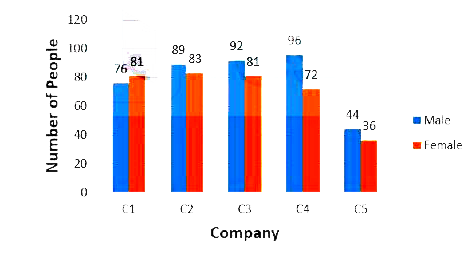
What is the average number of females working per company ?View SolutionThe given Bar graph presents the Export of Tea and Coffe ( in million kg ) for the years 2012 to 2016.
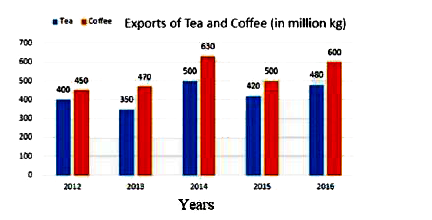
What is thr ratio of total export of tea in 2012 , 2014 and 2015 to the total export of coffee in 2013 and 2014 ?View SolutionThe Bar graph given below presents the number of males and females working in five different companies.
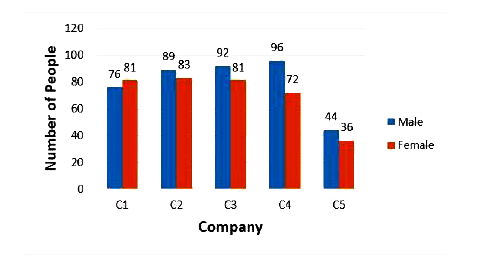
What is the ratio of the total number of males working in the Companies C2 and C3 to the total number of females working in C1 and C5 ?View SolutionThe table given below shows the percent-age of literate people in 6 cities . This table also shows the ratio of males to females among literate people .
City%of literate people Males : Females 1 80 4:5 2 85 7:4 3 78 3:2 4 63 1:1 5 92 9:7 6 58 2:3
% of literate people of any city = (Literate people of the city / Total population of the city ) ×100
Total population of city 6 is 200000 and the total population of city 2 is 220000 . What is the respective ratio of literate males of city 2 and literate females of city 6 ?View Solution

