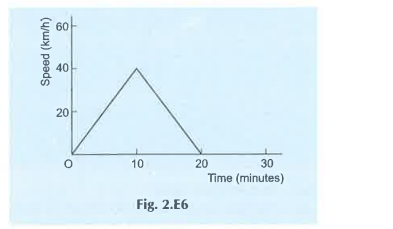
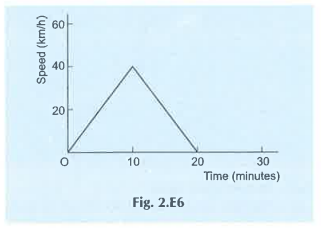
Figure 2.E6 shows the speed-time graph of a bus.
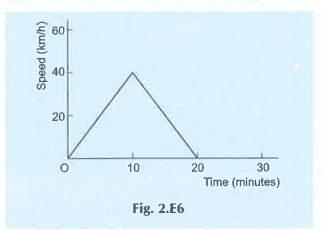
In which period is the bus decelerating ?
10 min -20 min
Topper's Solved these Questions
Similar Questions
Knowledge Check
The speed of a bus is 72 km/h. The distance covered by the bus in 5 s is :
A50 mB74. 5 mC100 mD60 mThe speed of a bus is 72 km/hr. The distance covered by the bus in 5 seocnds is
A100mB60mC50mD74.5mThe speed of a bus is 72 km/hr.The distance covered by the bus in 5 seconds is:
A60 mB74.5 mC100 mD50 m
Figure 2.E6 shows the speed-time graph of a bus.
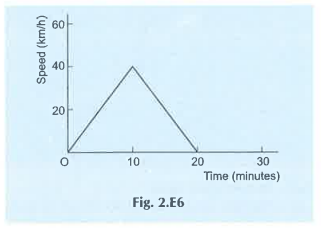
What is the distance covered during it deceleration ?
View SolutionWhat will be the position-time graph of a city bus standing at rest at a depot ?
View SolutionA student is running at her top speed of 5.0ms−1, to catch a bus, which is stopped at the bus stop. When the student is still 40.0m from the bus, it starts to pull away, moving with a constant acceleration of 0.2ms−2.
a For how much time and what distance does the student have to run at 5.0ms−1 before she overtakes the bus?
b. When she reached the bus, how fast was the bus travelling?
c. Sketch an x−t graph for bothe the student and the bus.
d. Teh equations uou used in part (a)to find the time have a second solution, corresponding to a later time for which the student and the bus are again at thesame place if they continue their specified motions. Explain the significance of this second solution. How fast is the bus travelling at this point?
e. If the students⊤speedis3.5 m s^(-1), will she catch the bus?
f. What is the minimum speed the student must have to just catch up with the bus?For what time and what distance dies she have to run in that case?
View SolutionA bus moves at a uniform speedv1for some time and then with a uniform speed v2. The distance-time table is given below. Plot the corresponding distance-time graph and answer the following questions .
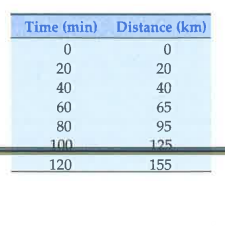
When did the bus change its speed?
View Solution

