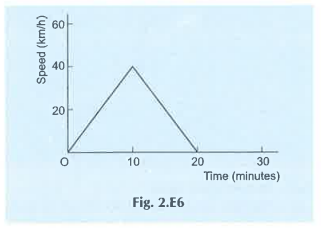
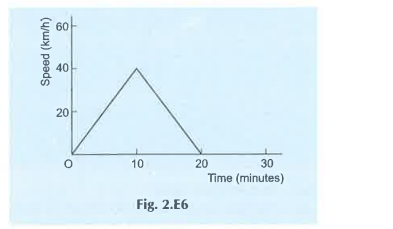
Figure 2.E6 shows the speed-time graph of a bus.
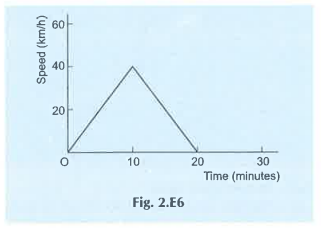
What is the distance covered during it deceleration ?
Text Solution
103km
|
Topper's Solved these Questions
Similar Questions
Knowledge Check
Figure shows the speed versus time graph for a particle. Find the distance travelled by the particle during the time t=0 to t=3s.
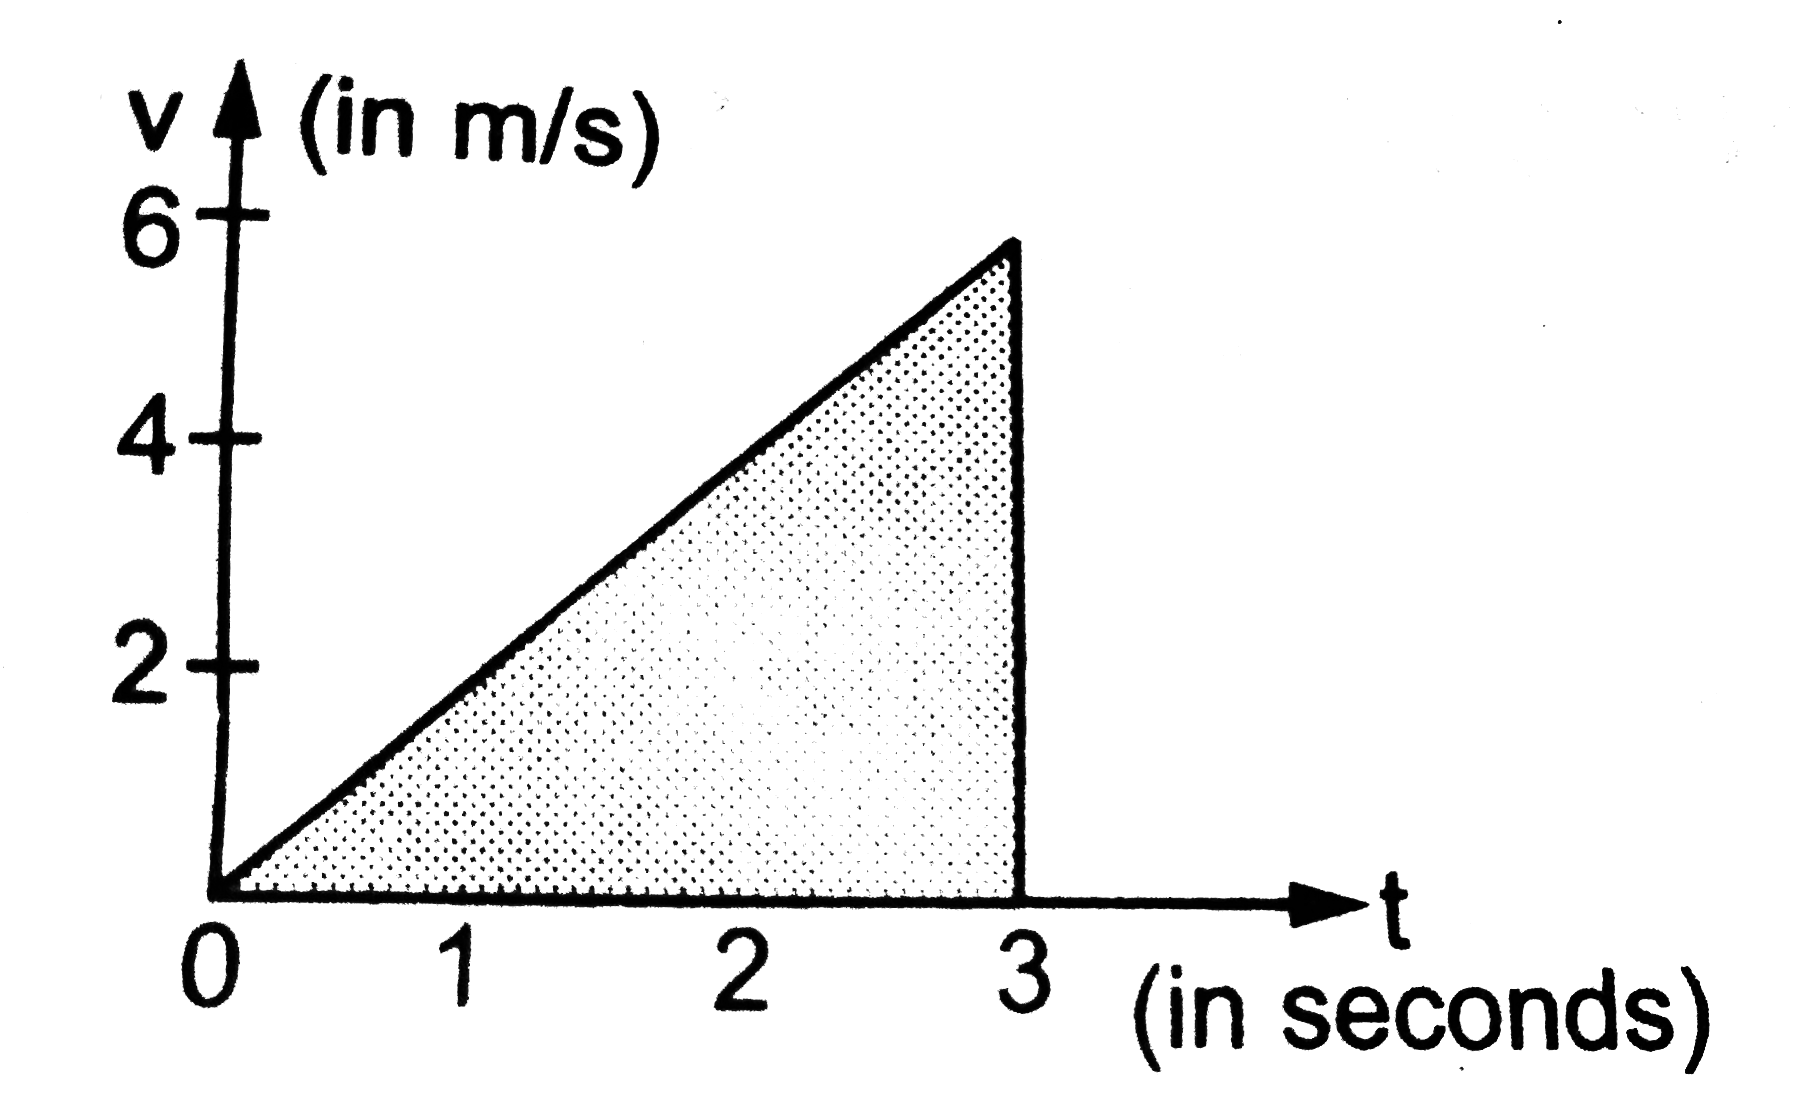 A9mB5mC2mD1m
The speed of a bus is 72 km/h. The distance covered by the bus in 5 s is :
A50 mB74. 5 mC100 mD60 mThe speed of a bus is 72 km/hr.The distance covered by the bus in 5 seconds is:
A60 mB74.5 mC100 mD50 m
Figure 2.E6 shows the speed-time graph of a bus.
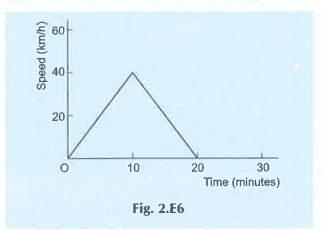
In which period is the bus decelerating ?
View SolutionFigure a represents the speed-time graph for a particle .Find the distance covered by the particle betweent=10 min and t= 30 min .

View SolutionFigure shows the speed versus time graph for a particle. Find the distance travelled by the particle during the time t=0 to t=3s.

View SolutionThe speed of a bus is 72 km/hr. The distance covered by the bus in 5 seocnds is
View SolutionDistance covered-time graph cannot be
View Solution

