Literacy rate measures the proportion of literate population in which age group?
The age group of 7 years and above.
Topper's Solved these Questions
Similar Questions
Knowledge Check
Proportion of literate population in the 7 and above age group is called as:
AKnowledge rateBLiteracy rateCAttendance rateDExcellence RateAge-gender structure is one of the most important characteristics of population composition. Almost all population characteristics vary significantly with age. Age statistics form an important component of population analysis. The usefulness of age data is more noticeable when it is cross classified by variables like marital status, literacy, economic activity which vary with age in different patterns.
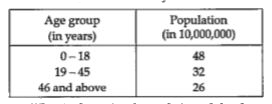
Suppose census report the population (approx.) of different age groups in the year 2020.
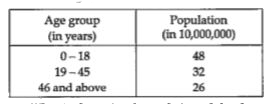
What is the ratio of population of the three age groups ?A24:16:13B13:16:24C16:24:13D13:24:16The population of a city increase at a rate proportional to the population at that time. In 40 years the population is increased from 30,000 to 40,000 then after time t, the population is
A(40000)(43)t40B(40000)(34)t40C(30000)(43)t40D(30000)(34)t40
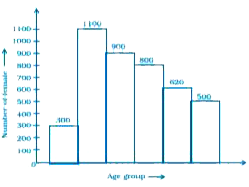
The below histogram shows the number of literate females in the age group of 10 to 40 years in a town.
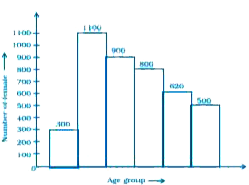
In which age group is the number of literate females the highest?
View SolutionHas the literacy rates of population increased since 1951?
View SolutionLiteracy rate in India is measured after which age ?
View SolutionAge-gender structure is one of the most important characteristics of population composition. Almost all population characteristics vary significantly with age. Age statistics form an important component of population analysis. The usefulness of age data is more noticeable when it is cross classified by variables like marital status, literacy, economic activity which vary with age in different patterns.
Suppose census report the population (approx.) of different age groups in the year 2020.
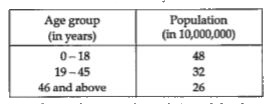
If z is the third proportion to 9 and 15, then the value of z is
View SolutionAge-gender structure is one of the most important characteristics of population composition. Almost all population characteristics vary significantly with age. Age statistics form an important component of population analysis. The usefulness of age data is more noticeable when it is cross classified by variables like marital status, literacy, economic activity which vary with age in different patterns.
Suppose census report the population (approx.) of different age groups in the year 2020.
If y is the mean population to 48 and 36, then the value of y is :
View Solution

