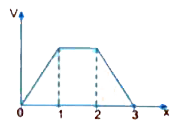
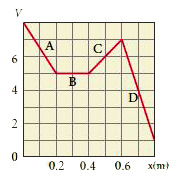
The electrostatic potential is given as a function of x in figure (a) and (b). Calculate the corresponding electric fields in regions A, B, C and D. Plot the electric field as a function of x for the figure (b).
Text Solution
EX=15Vm−1 (region A), EX=−10Vm−1 (region C)
EX=0 (region B), EX=30Vm−1 (region D)
|
Topper's Solved these Questions
- ELECTROSTATICSBOOK - NCERT TAMILCHAPTER - ELECTROSTATICSEXERCISE - EVALUATION (Multiple choice questions)
15 Videos
- ELECTROSTATIC POTENTIAL AND CAPACITANCE BOOK - NCERT TAMILCHAPTER - ELECTROSTATIC POTENTIAL AND CAPACITANCE EXERCISE - ADDITIONAL EXERCISES
1 Videos
- MAGNETISM AND MAGNETIC EFFECTS OF ELECTRIC CURRENTBOOK - NCERT TAMILCHAPTER - MAGNETISM AND MAGNETIC EFFECTS OF ELECTRIC CURRENTEXERCISE - EVALUATION (IV. Numerical problems)
10 Videos
Similar Questions
Knowledge Check
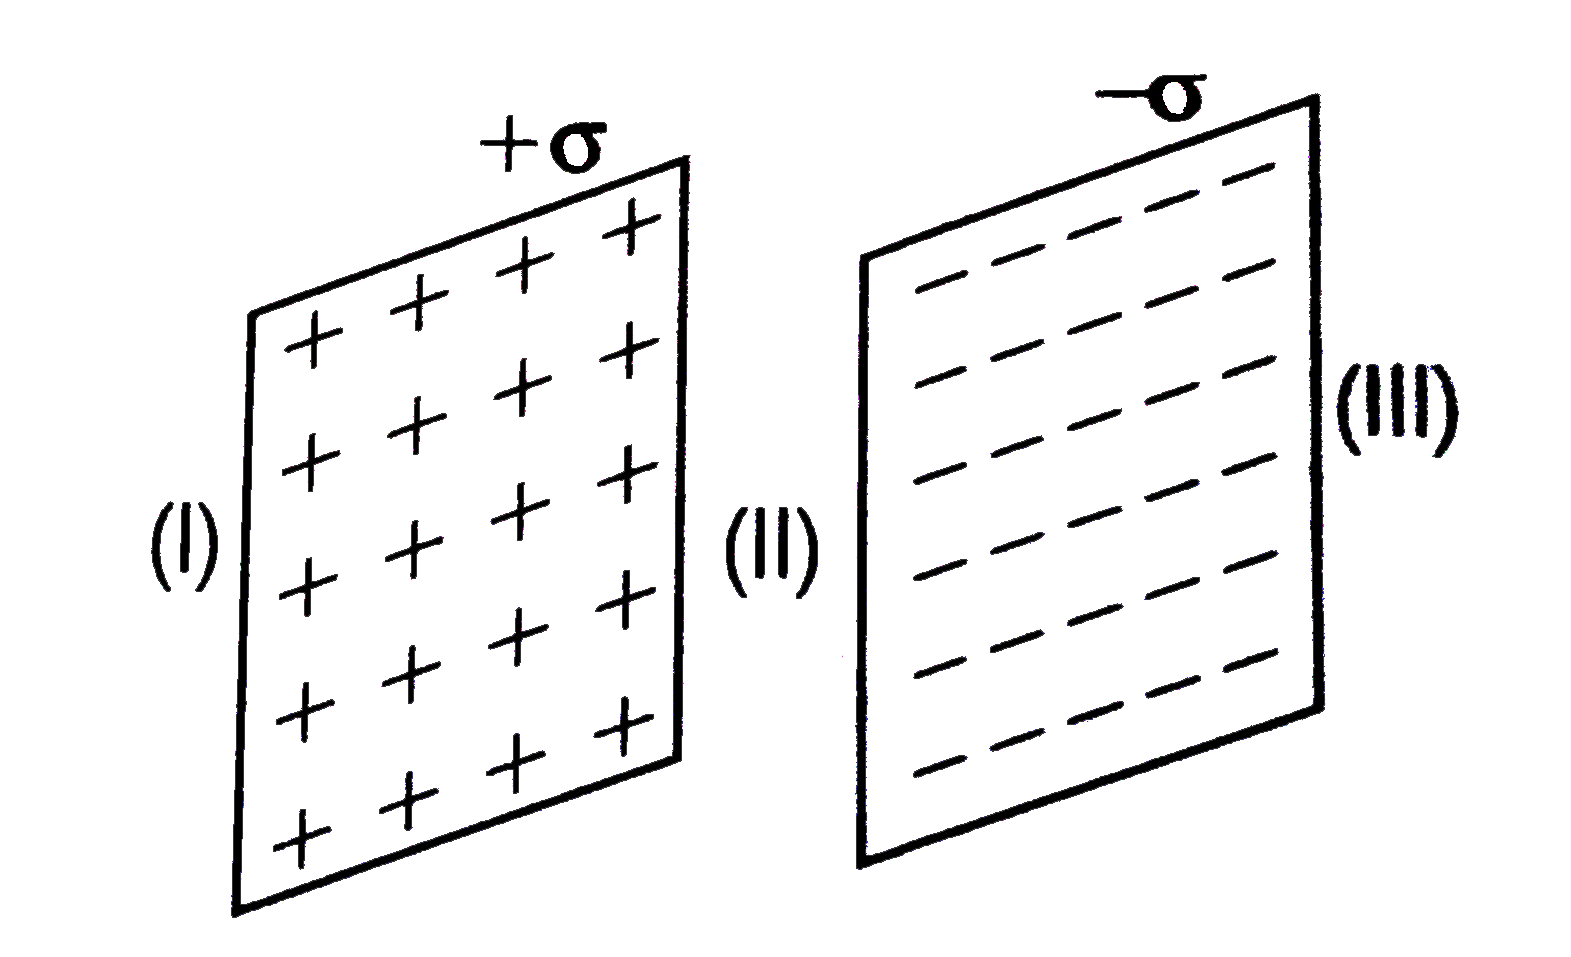
Find the electric field in region II as shown in figure.
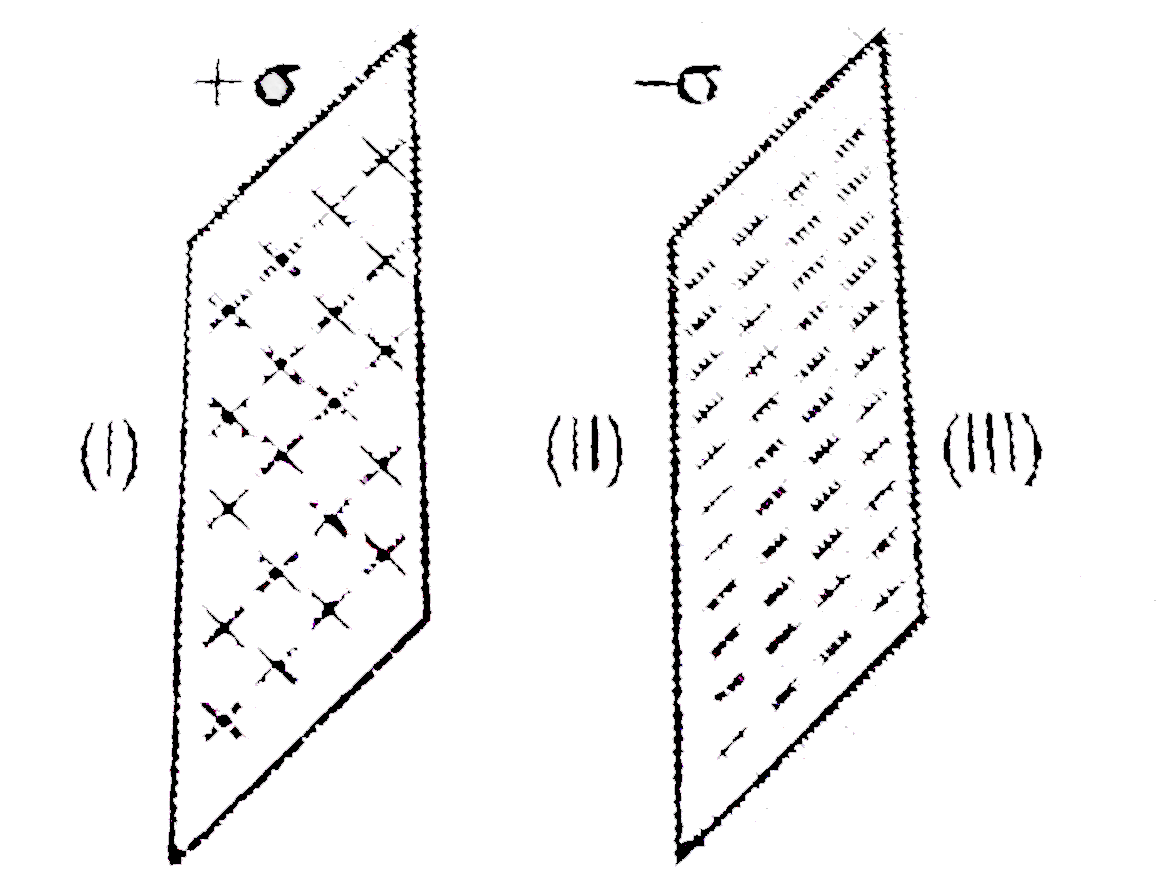 AzeroBσ4πε0Cσε0DInfinite
The variation of electric potential with distance from a fixed point is shown in figure. What is the value of electric field at x=2m -
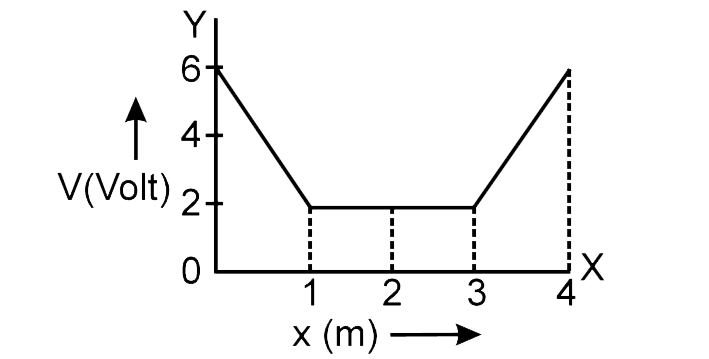 AZeroB6/2C6/1D6/3
A graph of the x-component of the electric field as a function of x in a region of space is shown in figure. The y−andz−compo≠nts of the electric field are zero in this region. If the electric potential is 10 V at the origin, then the potential at x = 2.0 m is
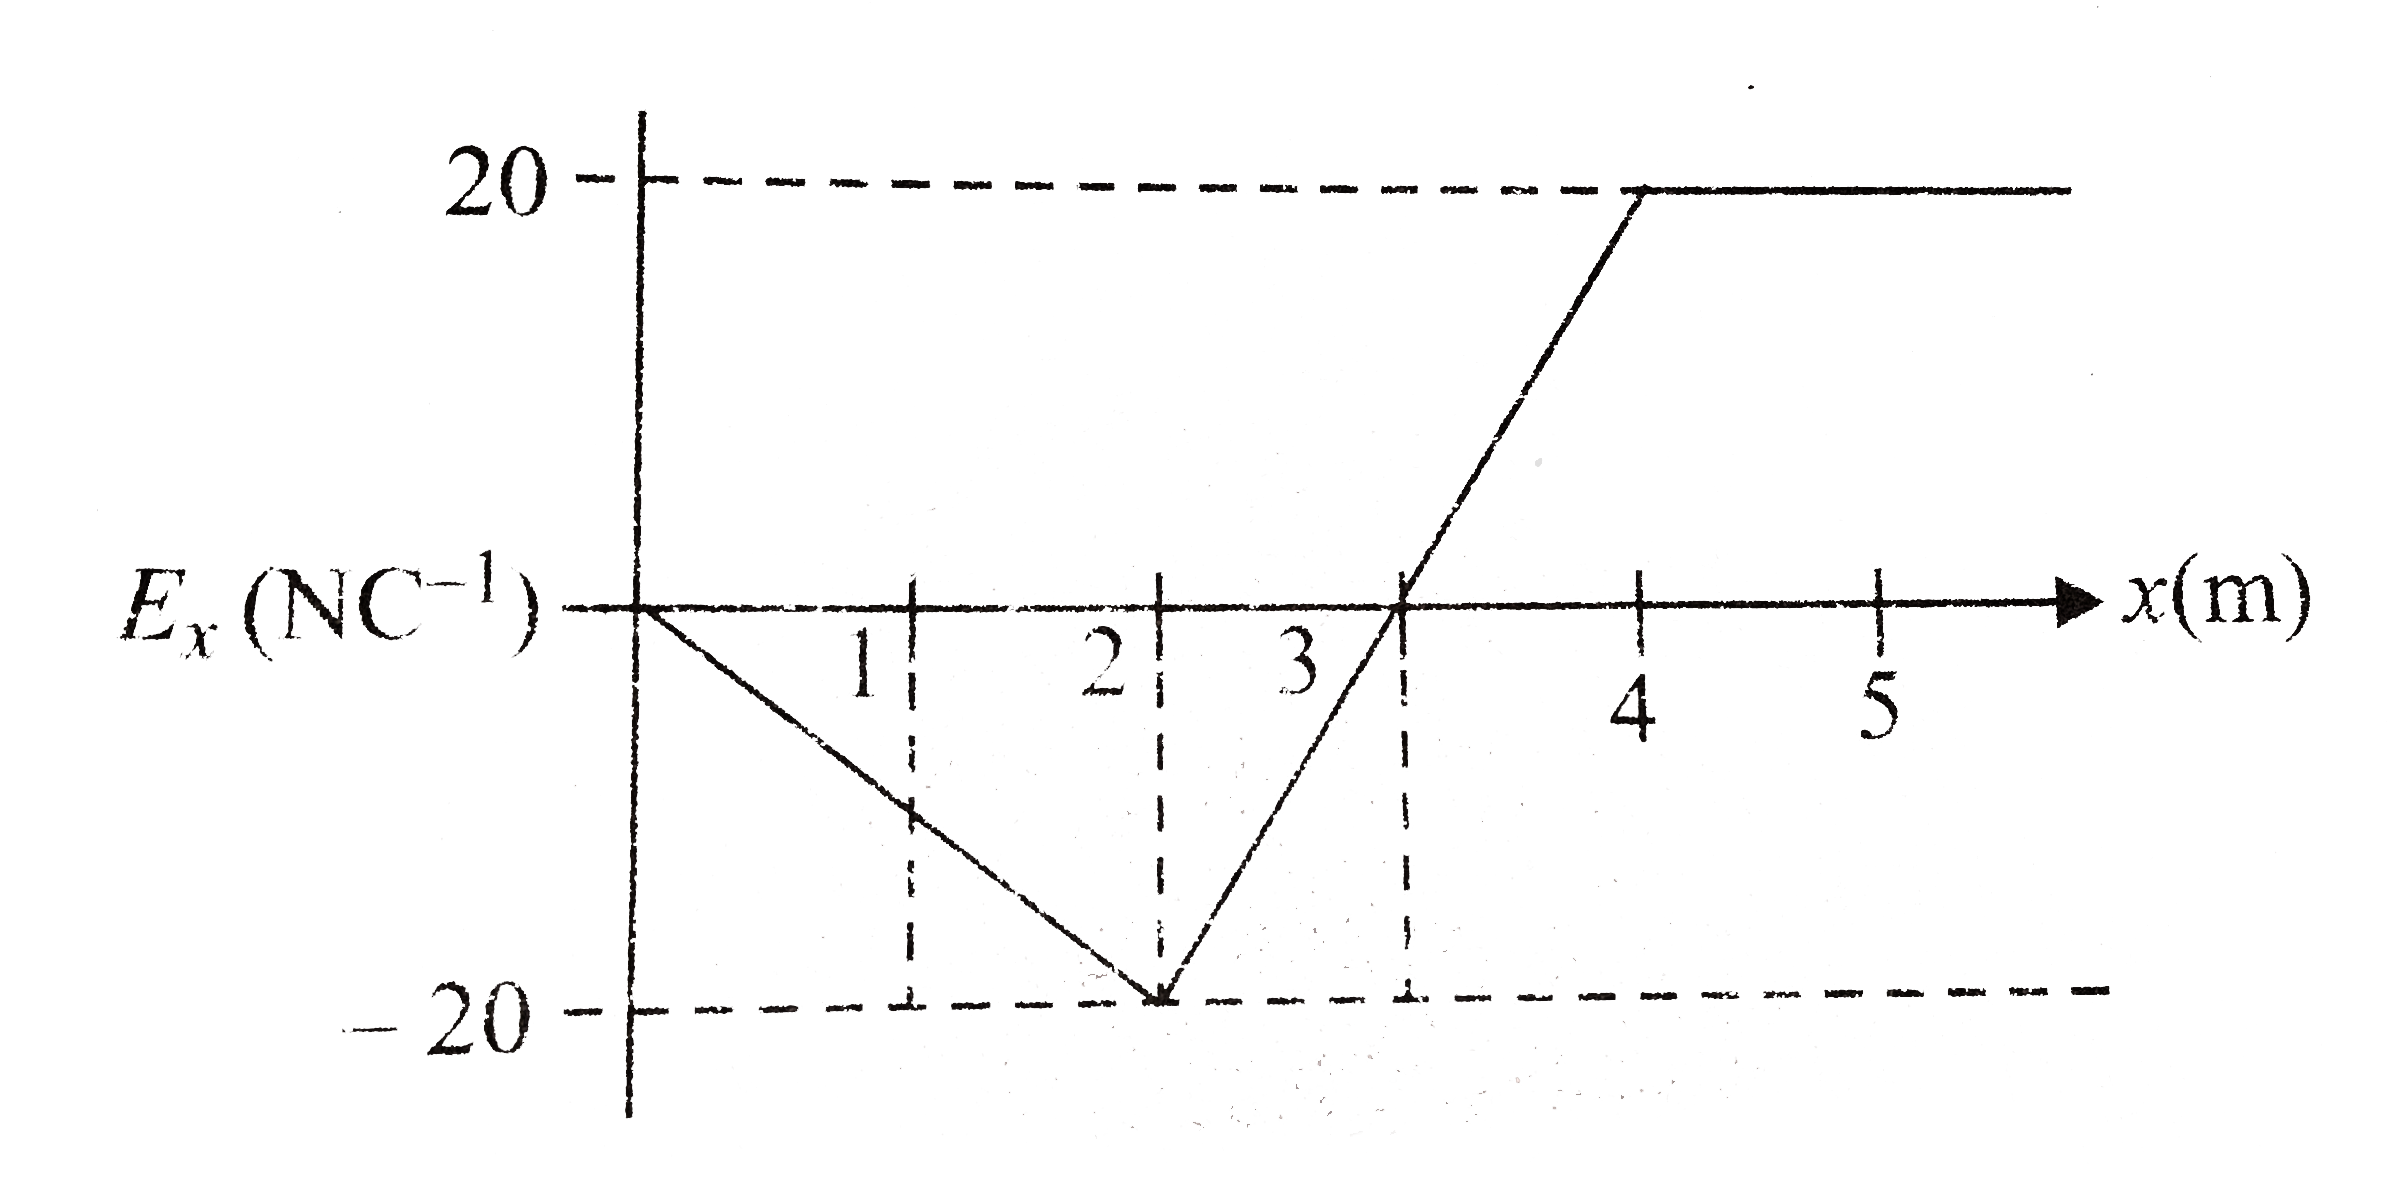 A10VB40VC−10VD30V
Find the electric field in region II as in figure shown.
View SolutionThe figure shows electric field lines. If EA and EB are electric fields at A and B and distance AB is r, then
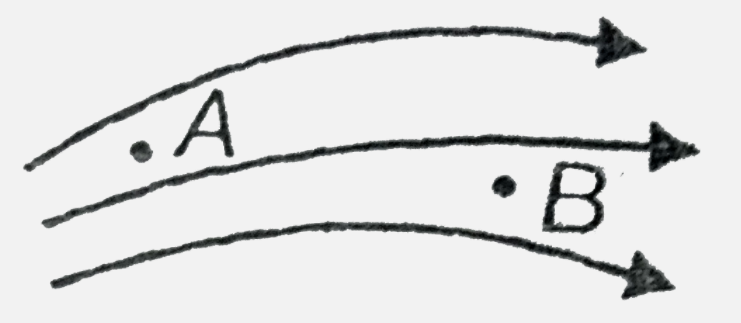
View SolutionThe figure shows electric field lines. If EA and EB are electric fields at A and B and distance AB is r, then

View SolutionThe variation of electric field on the y-axis as a function of 'y' is best represented by [for the given figure]:
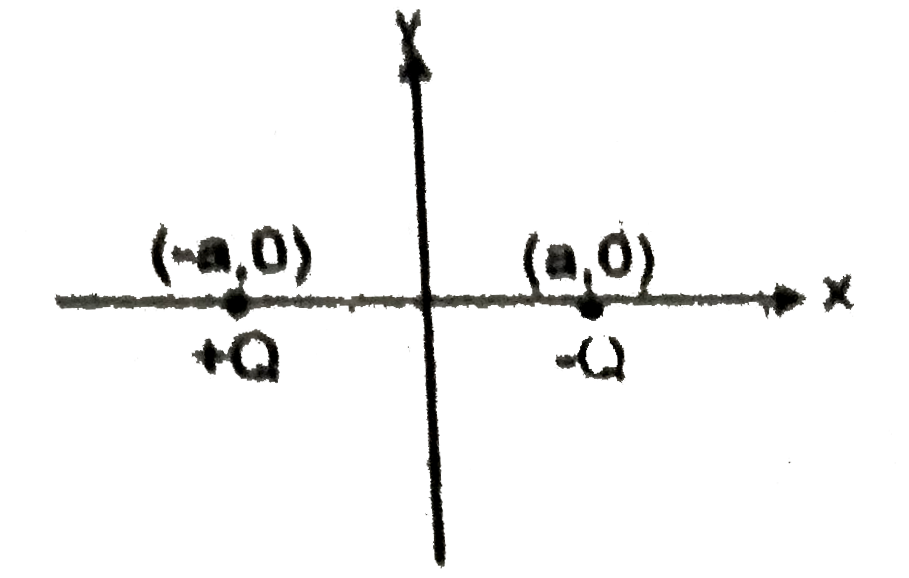
A.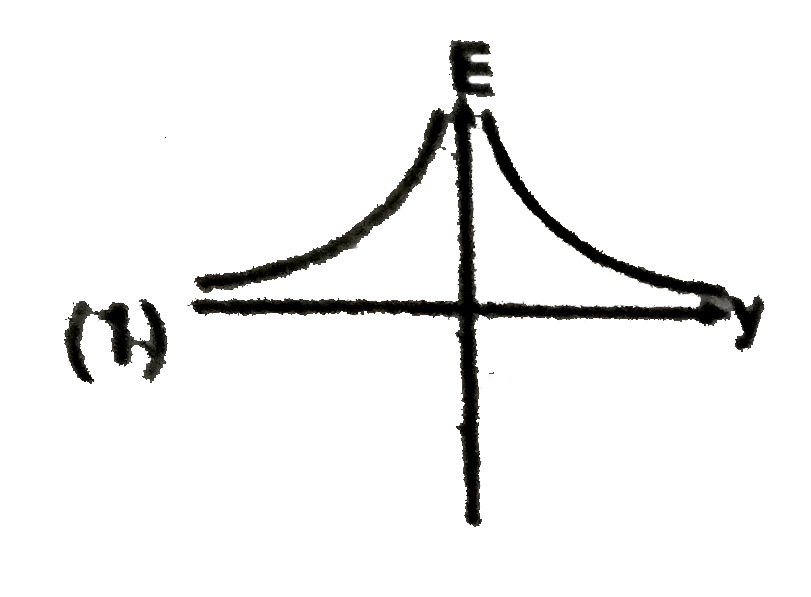
B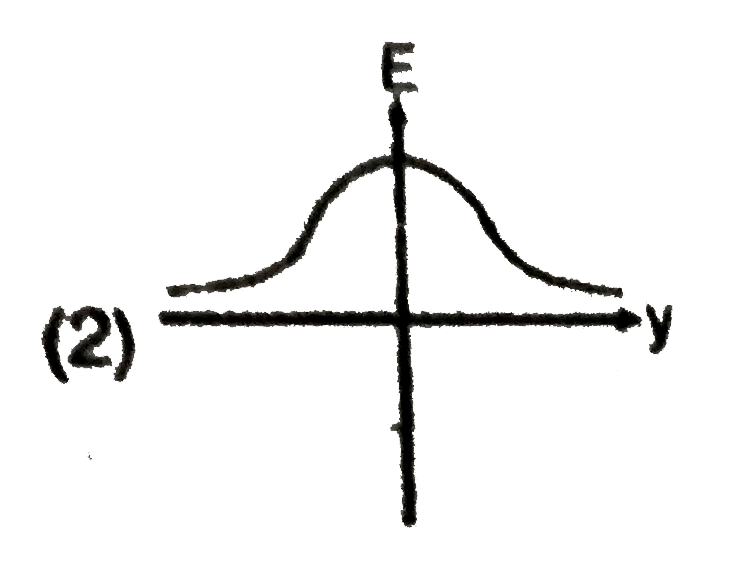
C.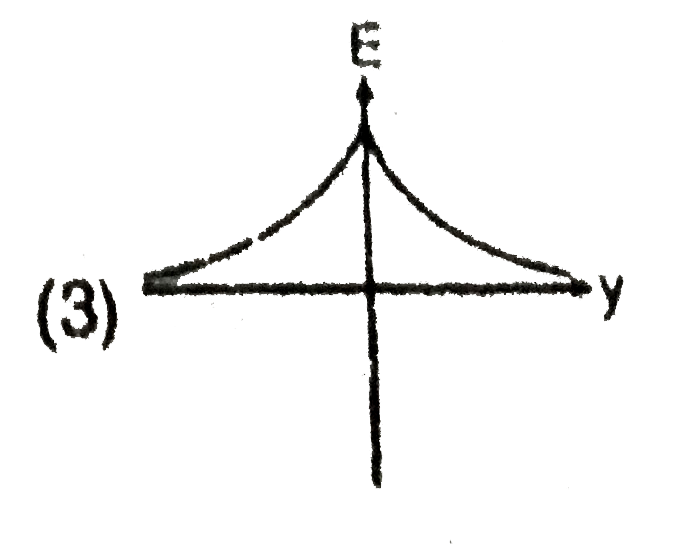
D.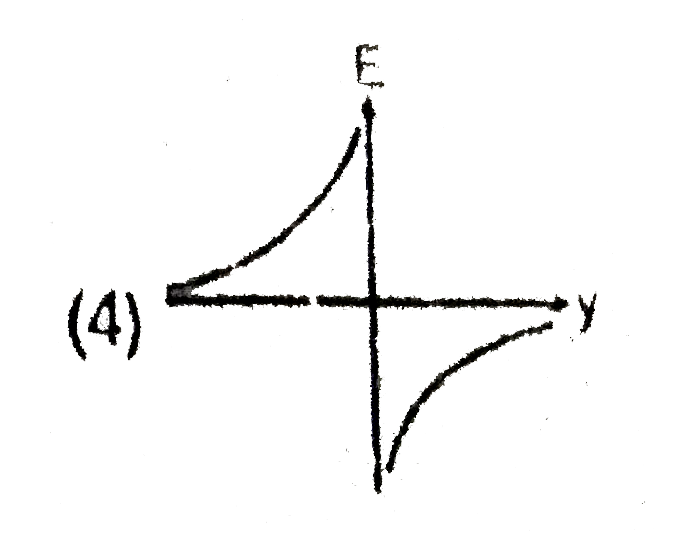
View SolutionThe field lines corresponding to an electric filed is shown in the figure then ( E denotes electric field and V denotes electric potential)
View Solution

