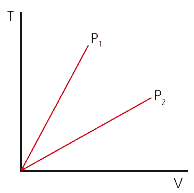
The following graph shows a V-T graph for isobaric process at two different presures. Identify which one occurs at higher pressure.
Text Solution
From the ideal gas equation, V=(μRP)T
V-T Graph is a straight line passing the origin.
The slope=μRp
The slope of V-T graph is inverselly proportional to the pressure. If the slope is greater, lowe is the pressure.
Here p1 has larger slope than P2. So P2>P1.
|
Topper's Solved these Questions
- HEAT AND THERMODYNAMICSBOOK - NCERT TAMILCHAPTER - HEAT AND THERMODYNAMICSEXERCISE - EVALUATION (MULTIPLE CHOICE QUESTIONS)
15 Videos
- HEAT AND THERMODYNAMICSBOOK - NCERT TAMILCHAPTER - HEAT AND THERMODYNAMICSEXERCISE - EVALUATION (Numerical Problems)
13 Videos
- GRAVITATIONBOOK - NCERT TAMILCHAPTER - GRAVITATIONEXERCISE - ADDITIONAL EXERCISES
4 Videos
- KINEMATICSBOOK - NCERT TAMILCHAPTER - KINEMATICSEXERCISE - EXERCISE (IV. Exercises )
20 Videos
Similar Questions
Knowledge Check
Which of the following is a V-T curve for isobaric process?
A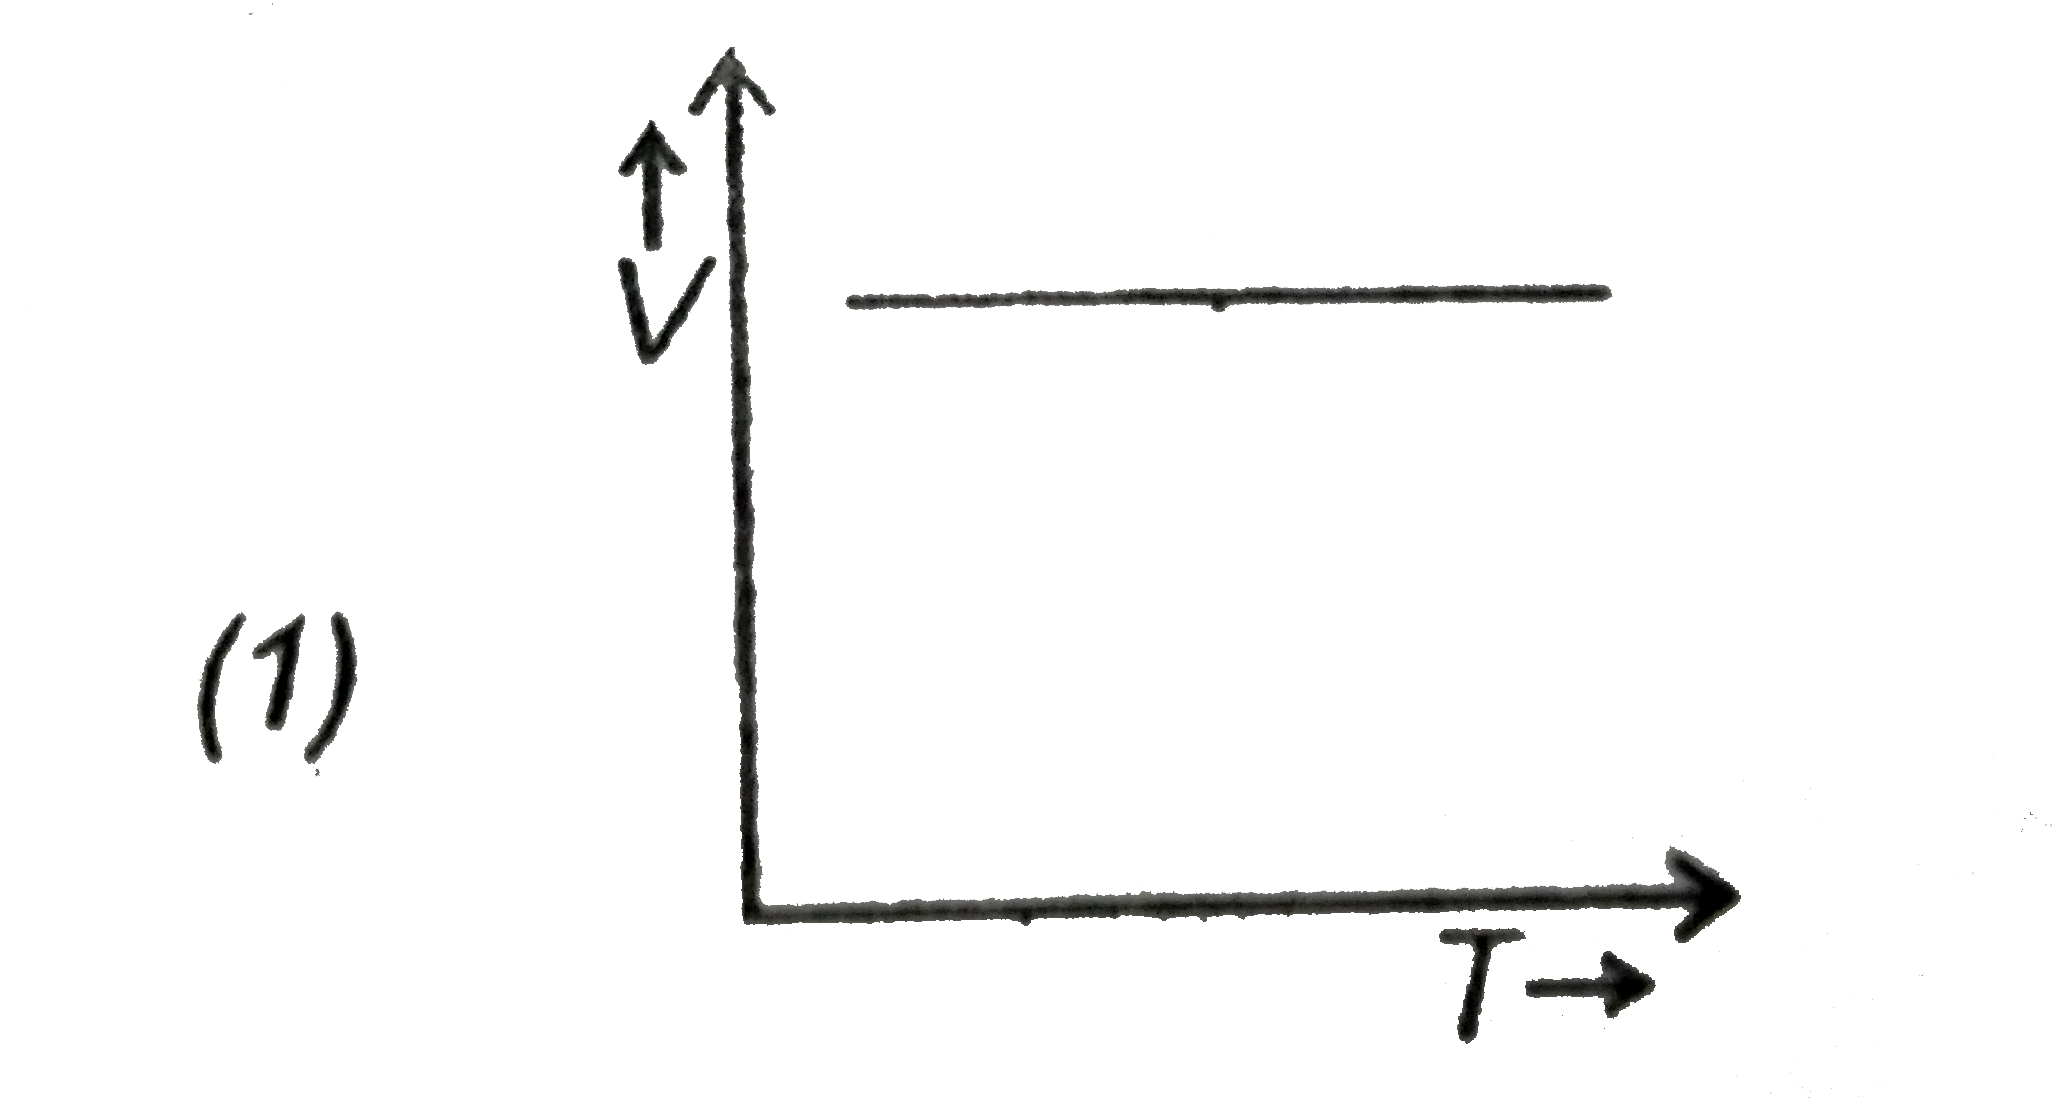 B
B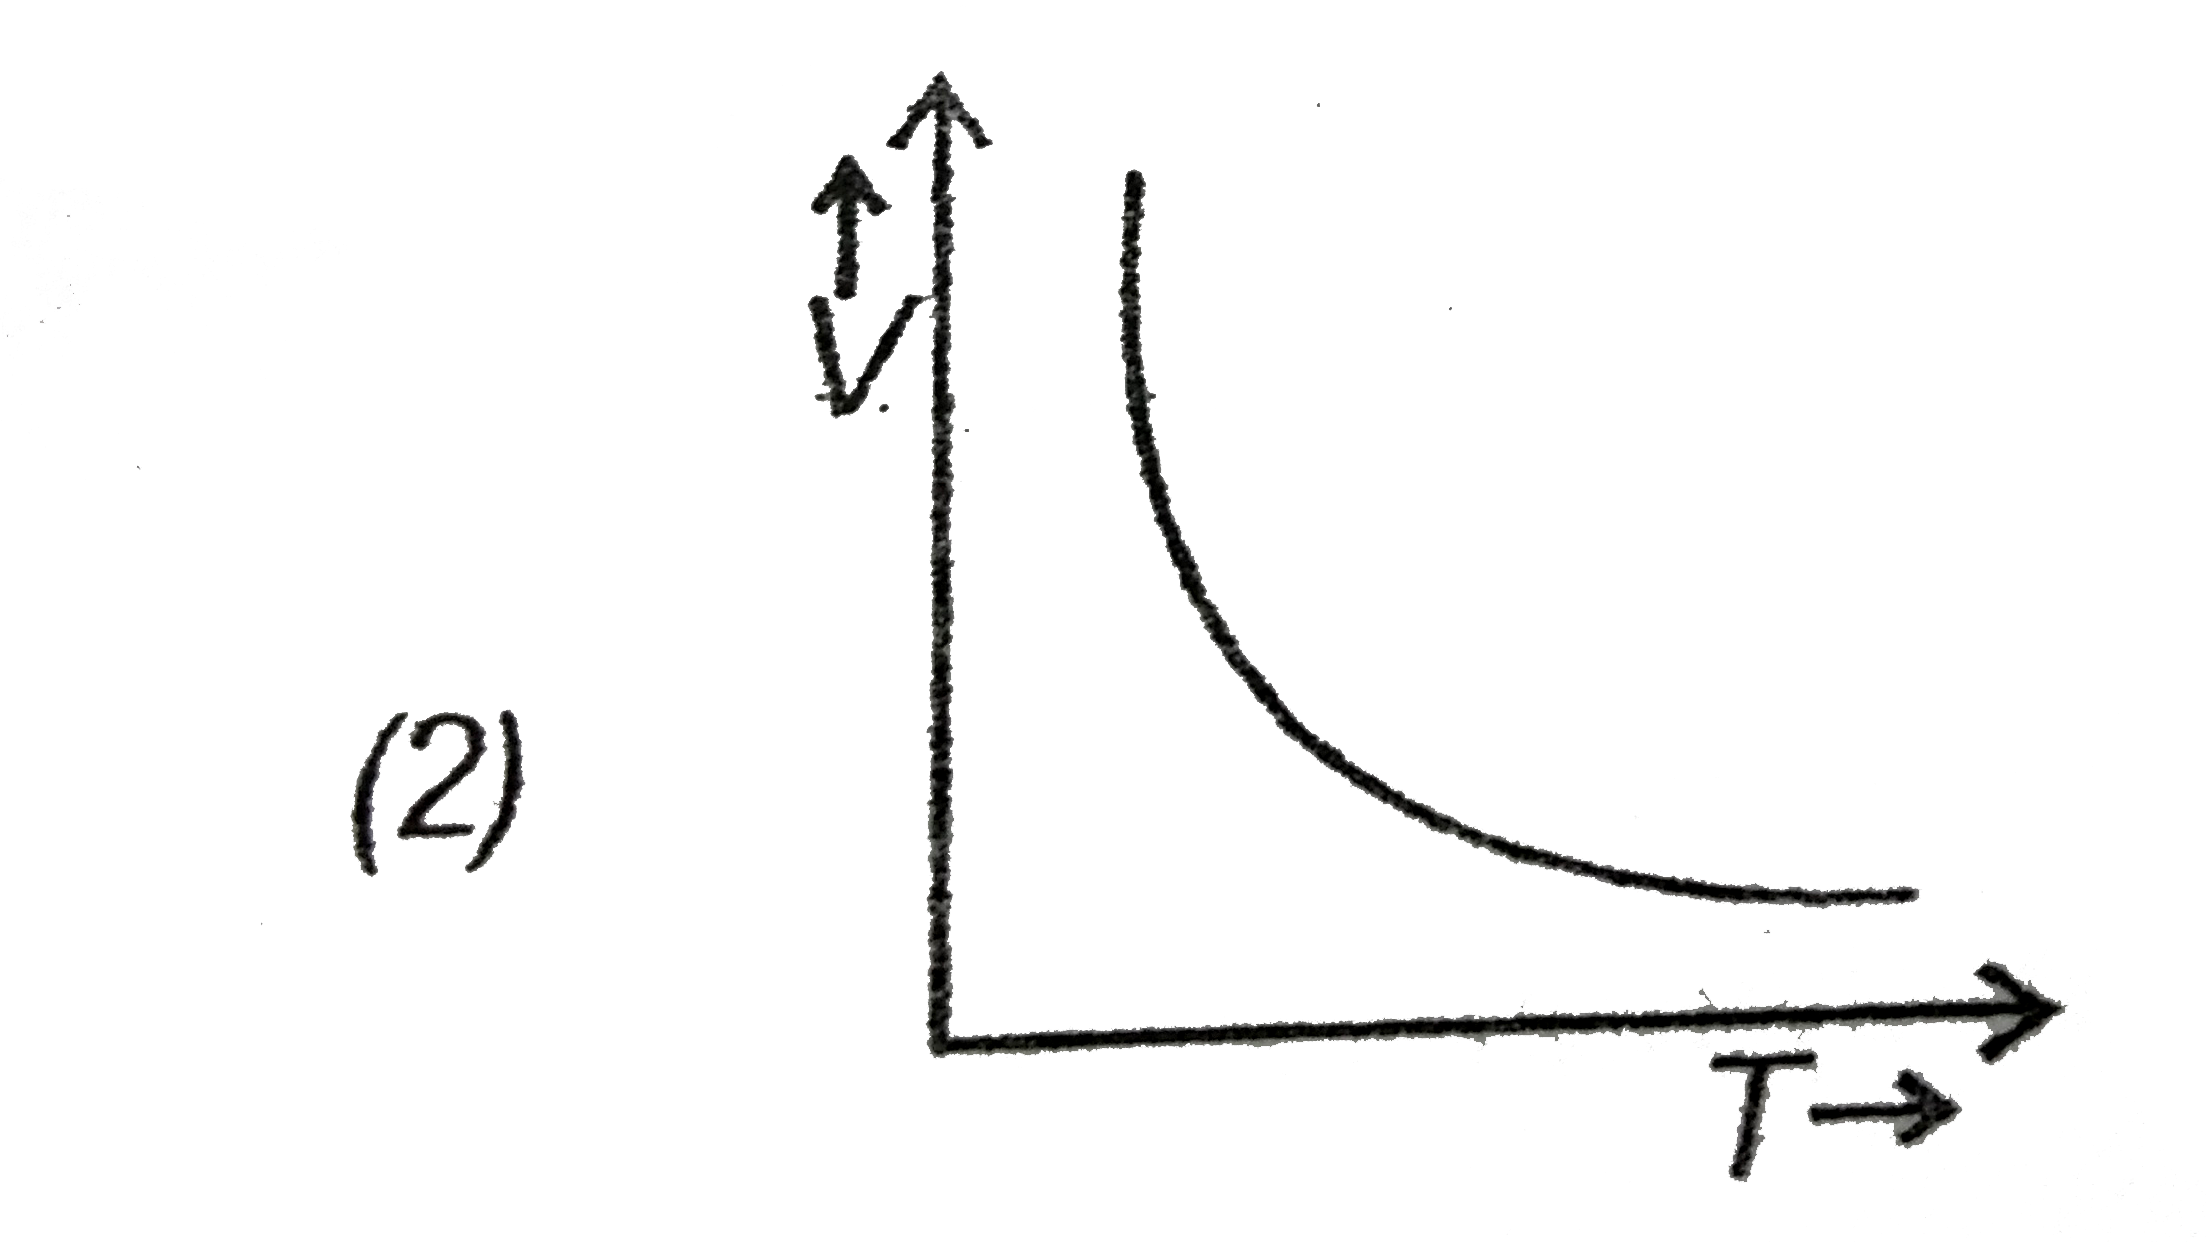 C
C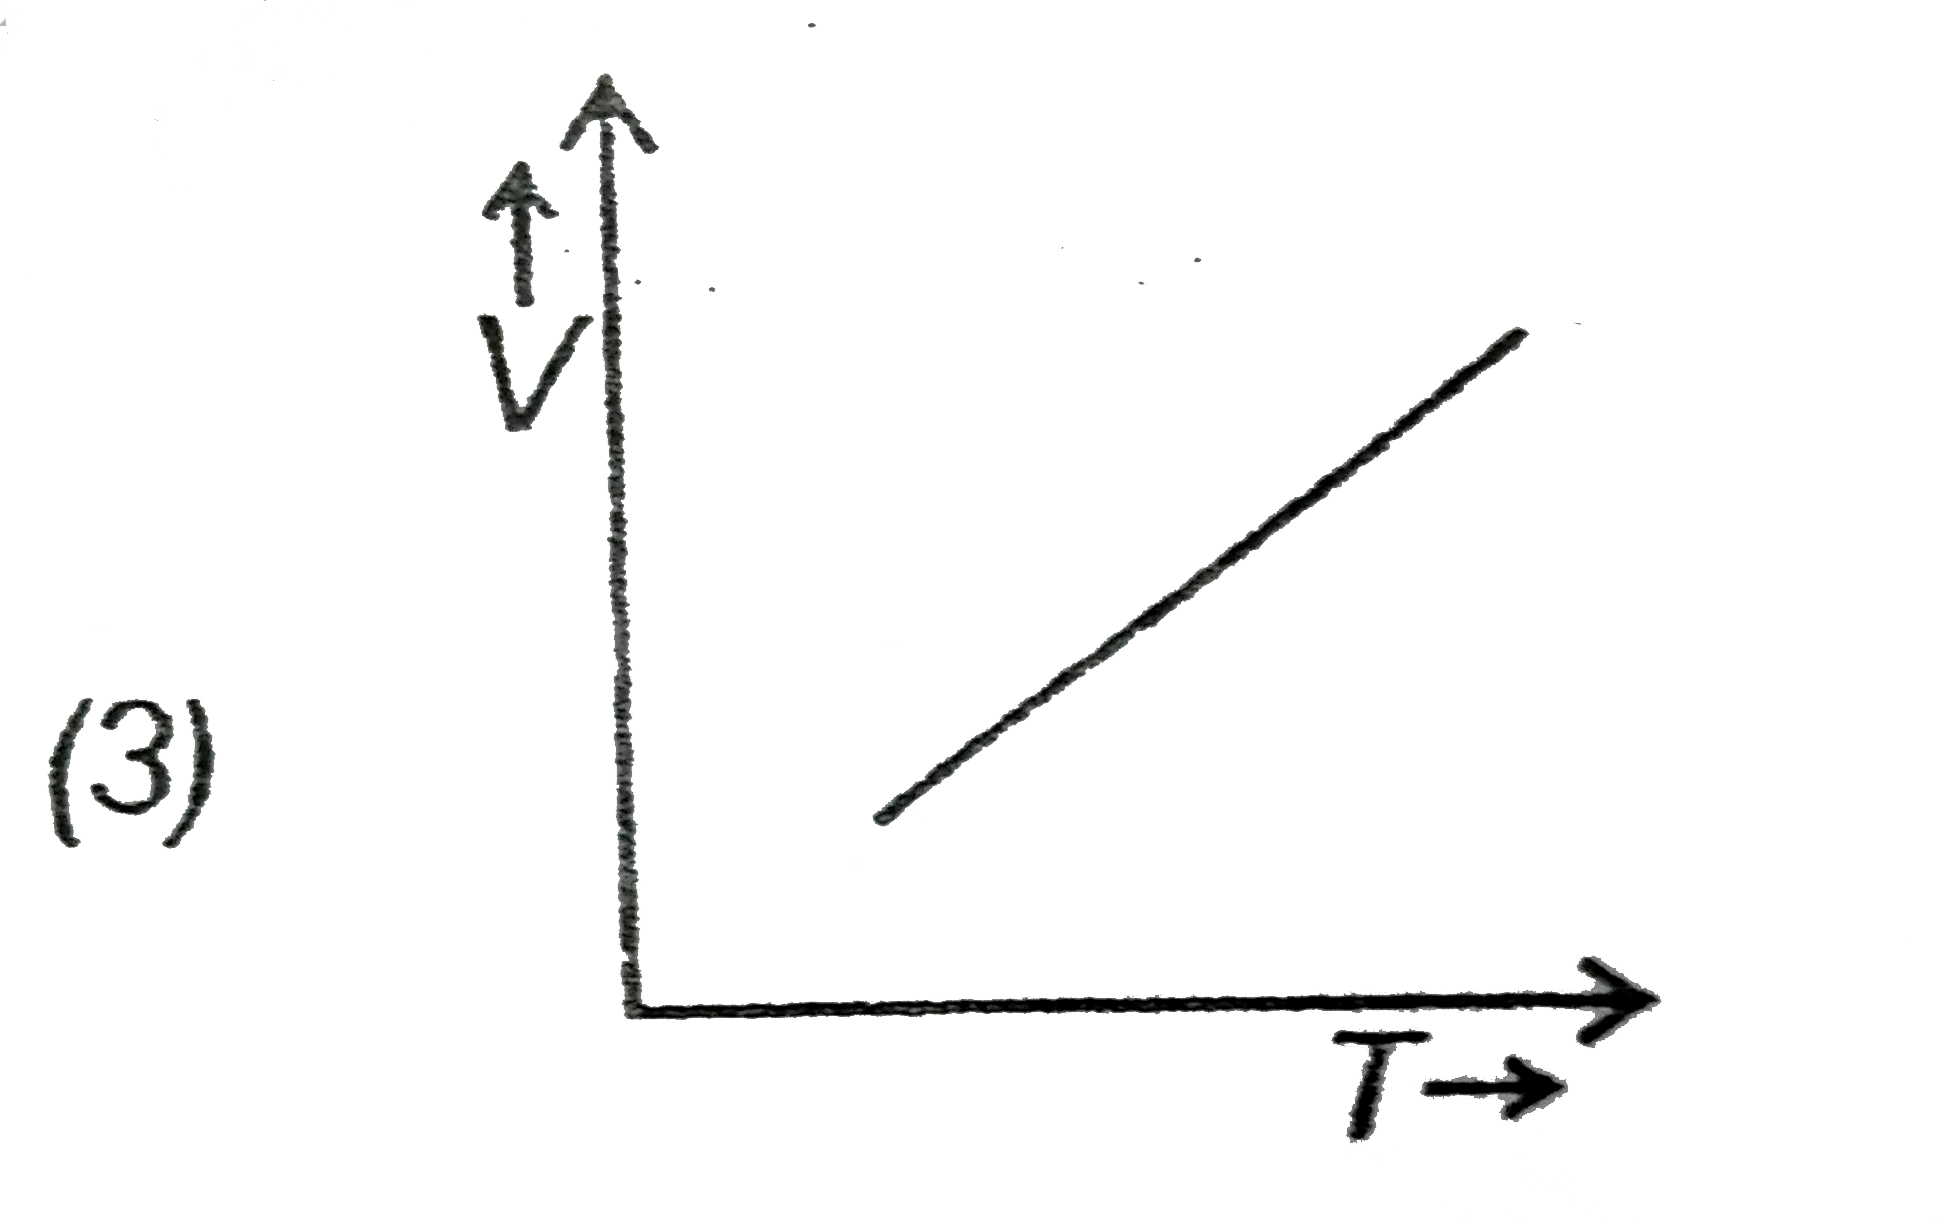 D
D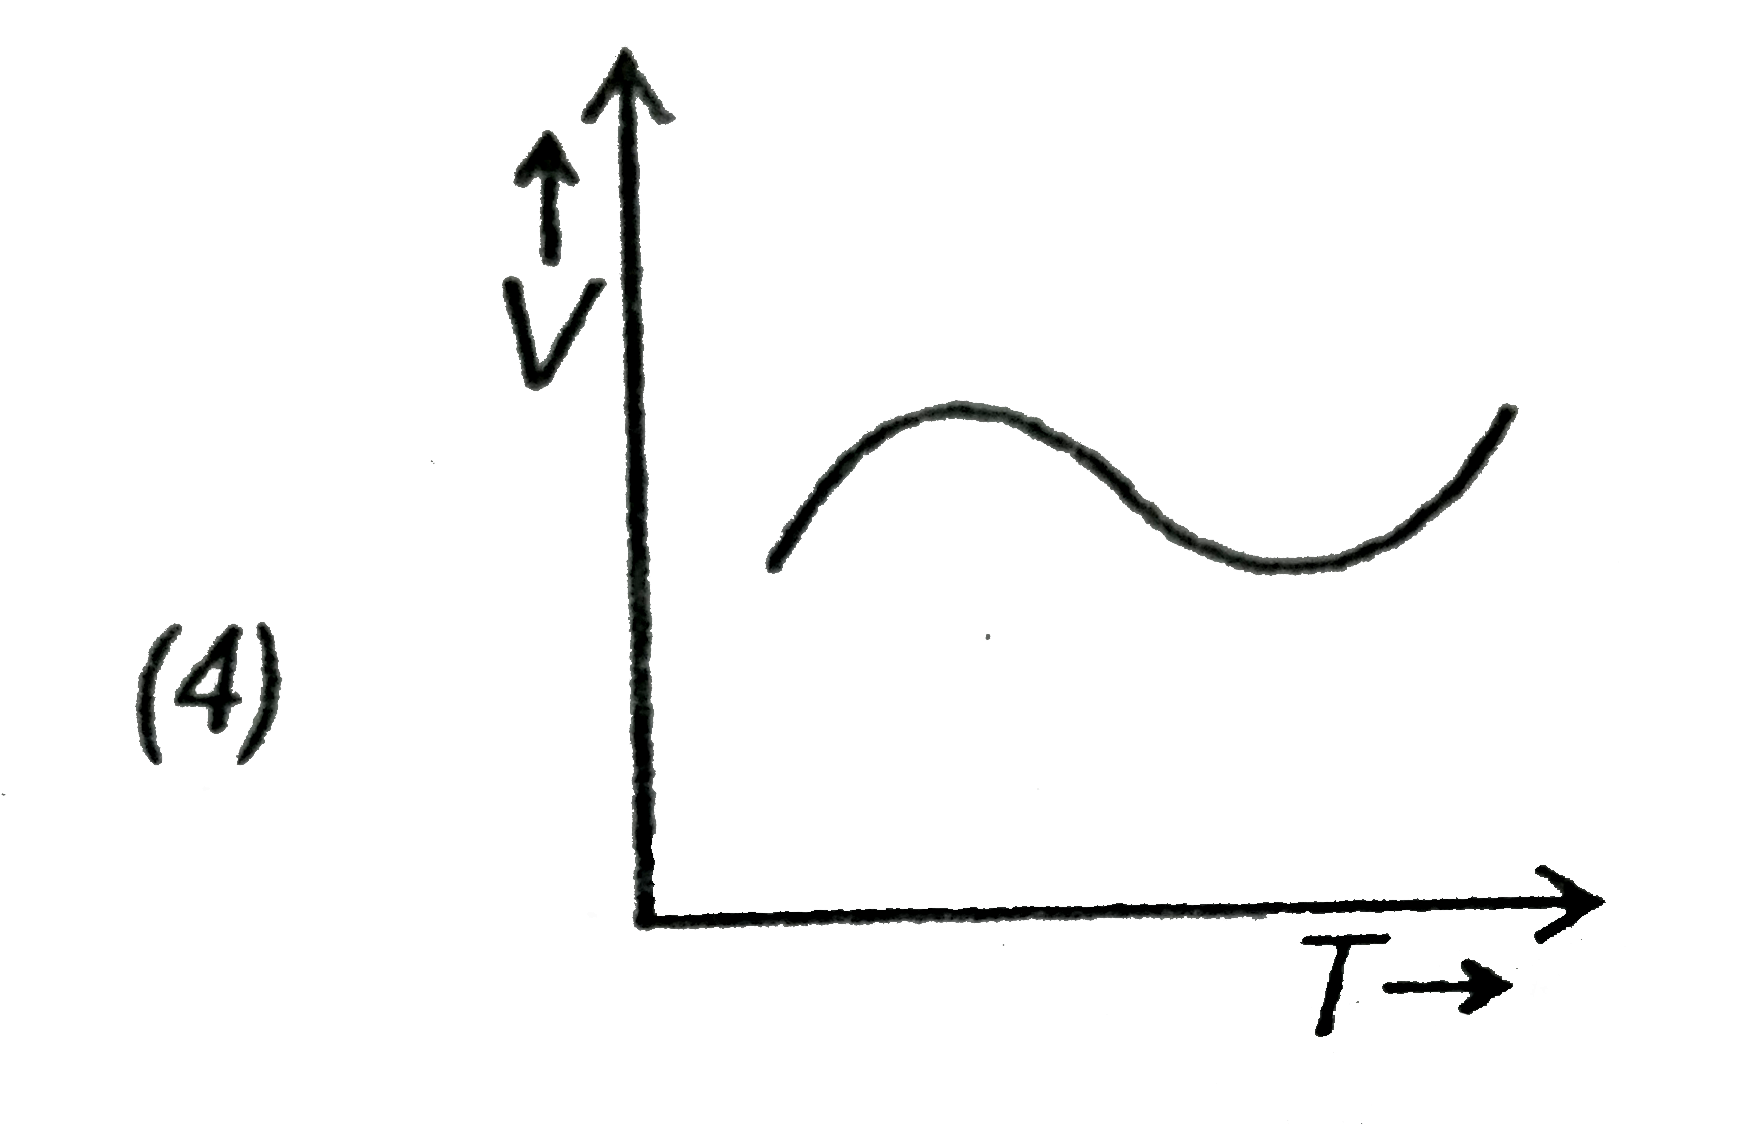
Which of the following graphs show the v−t graph of a ball thrown upwards ?
A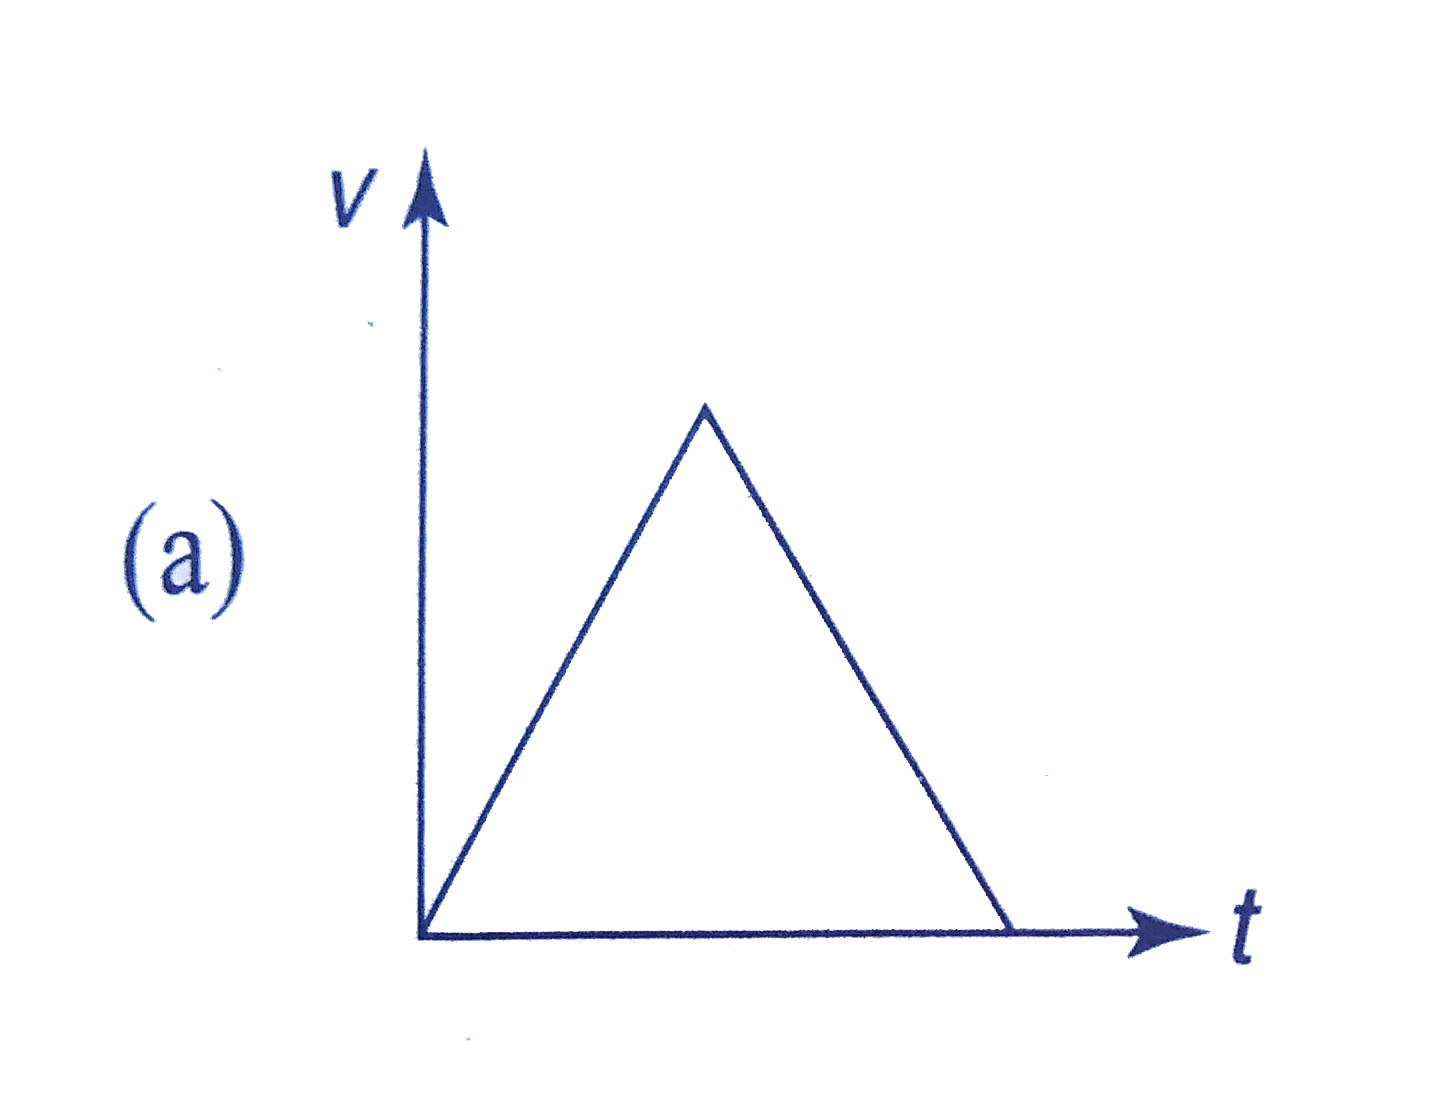 .B
.B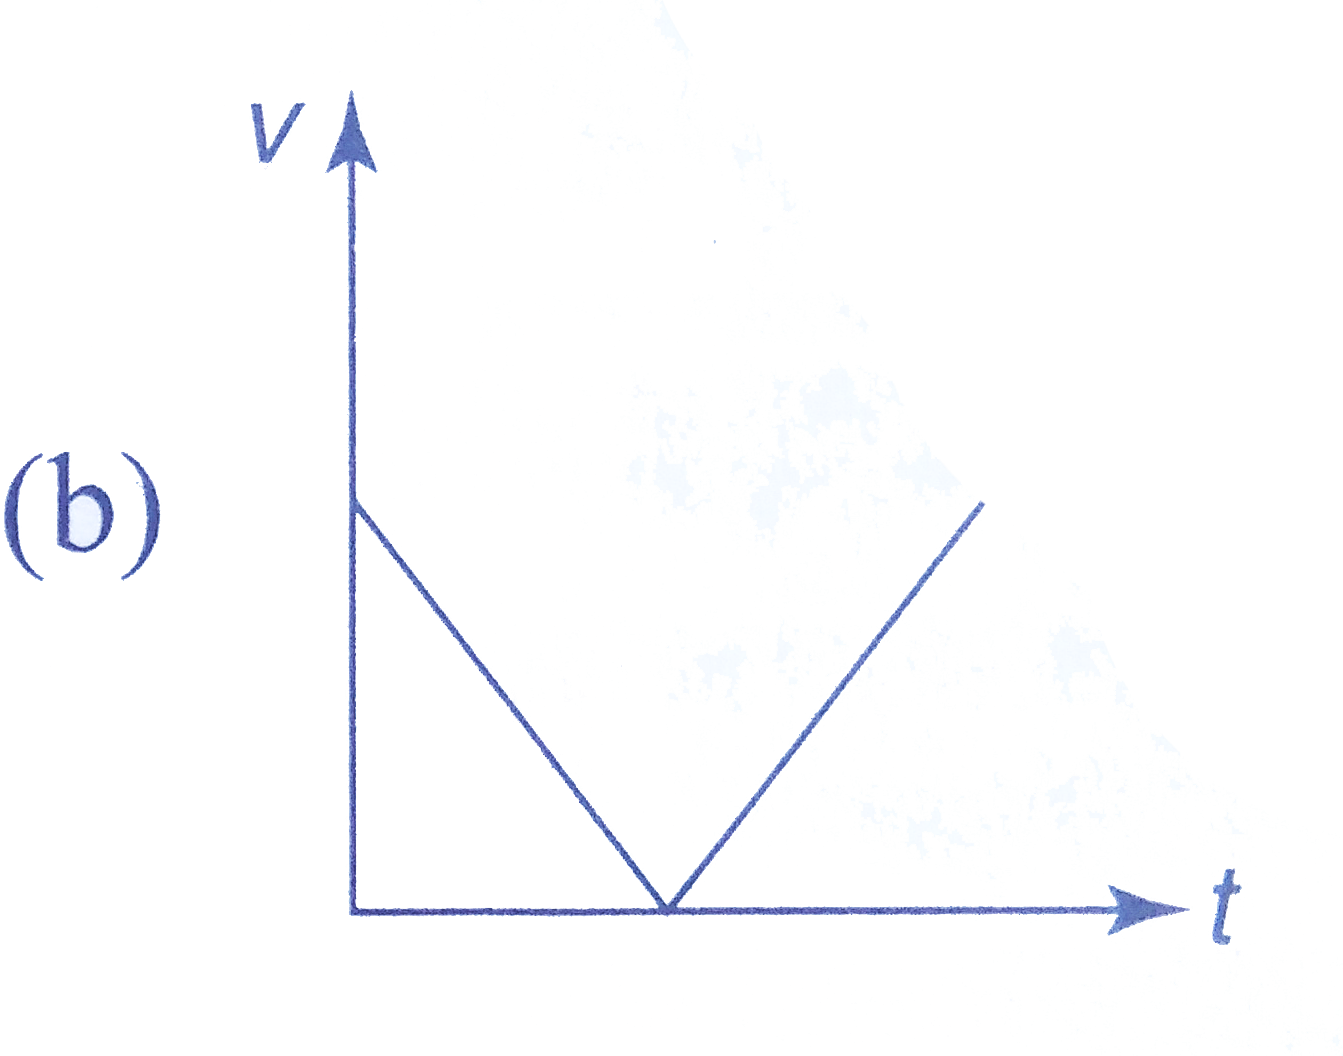 .C
.C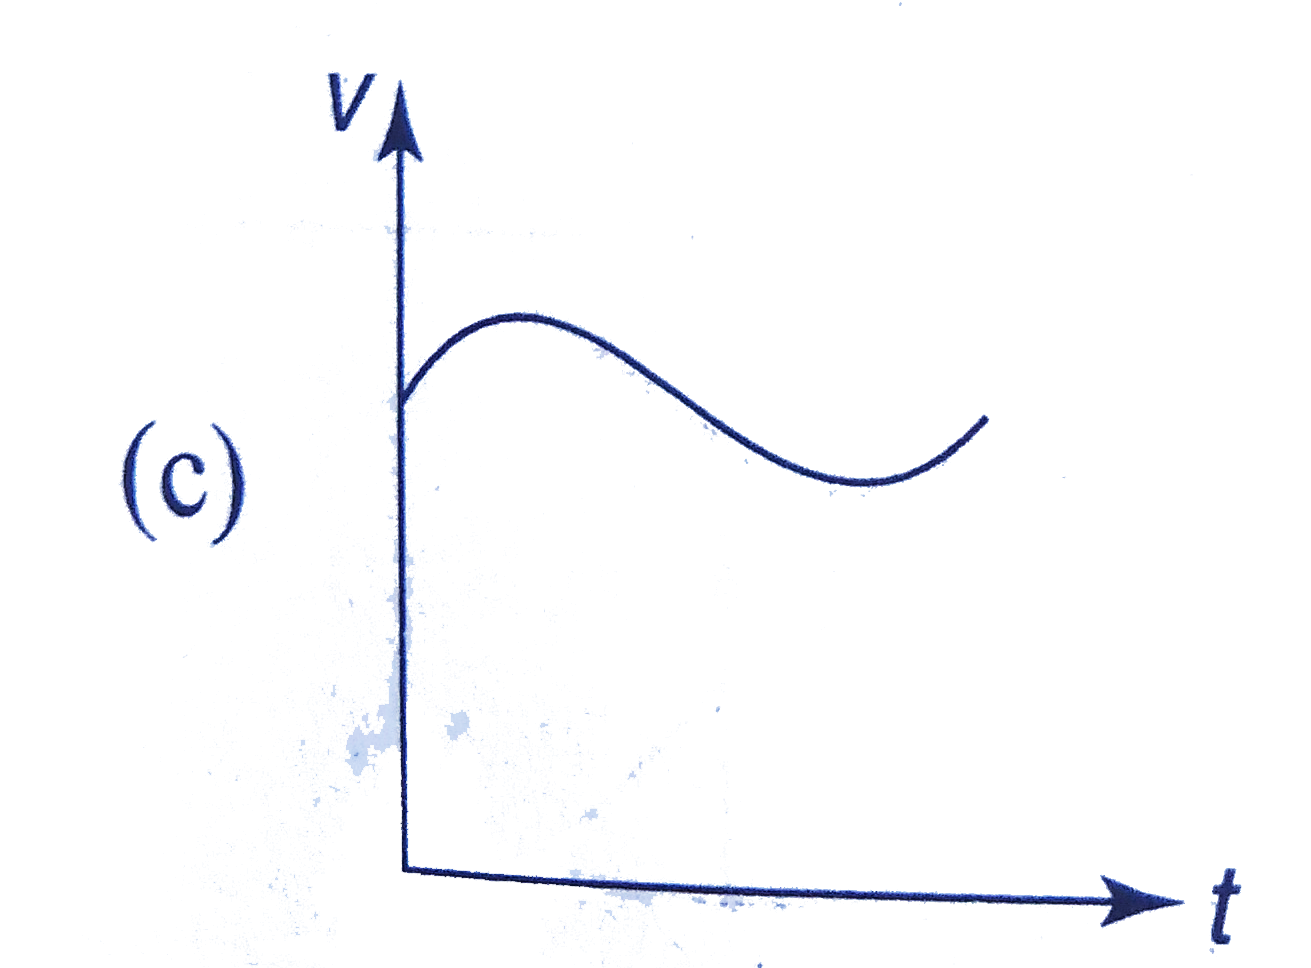 .D
.D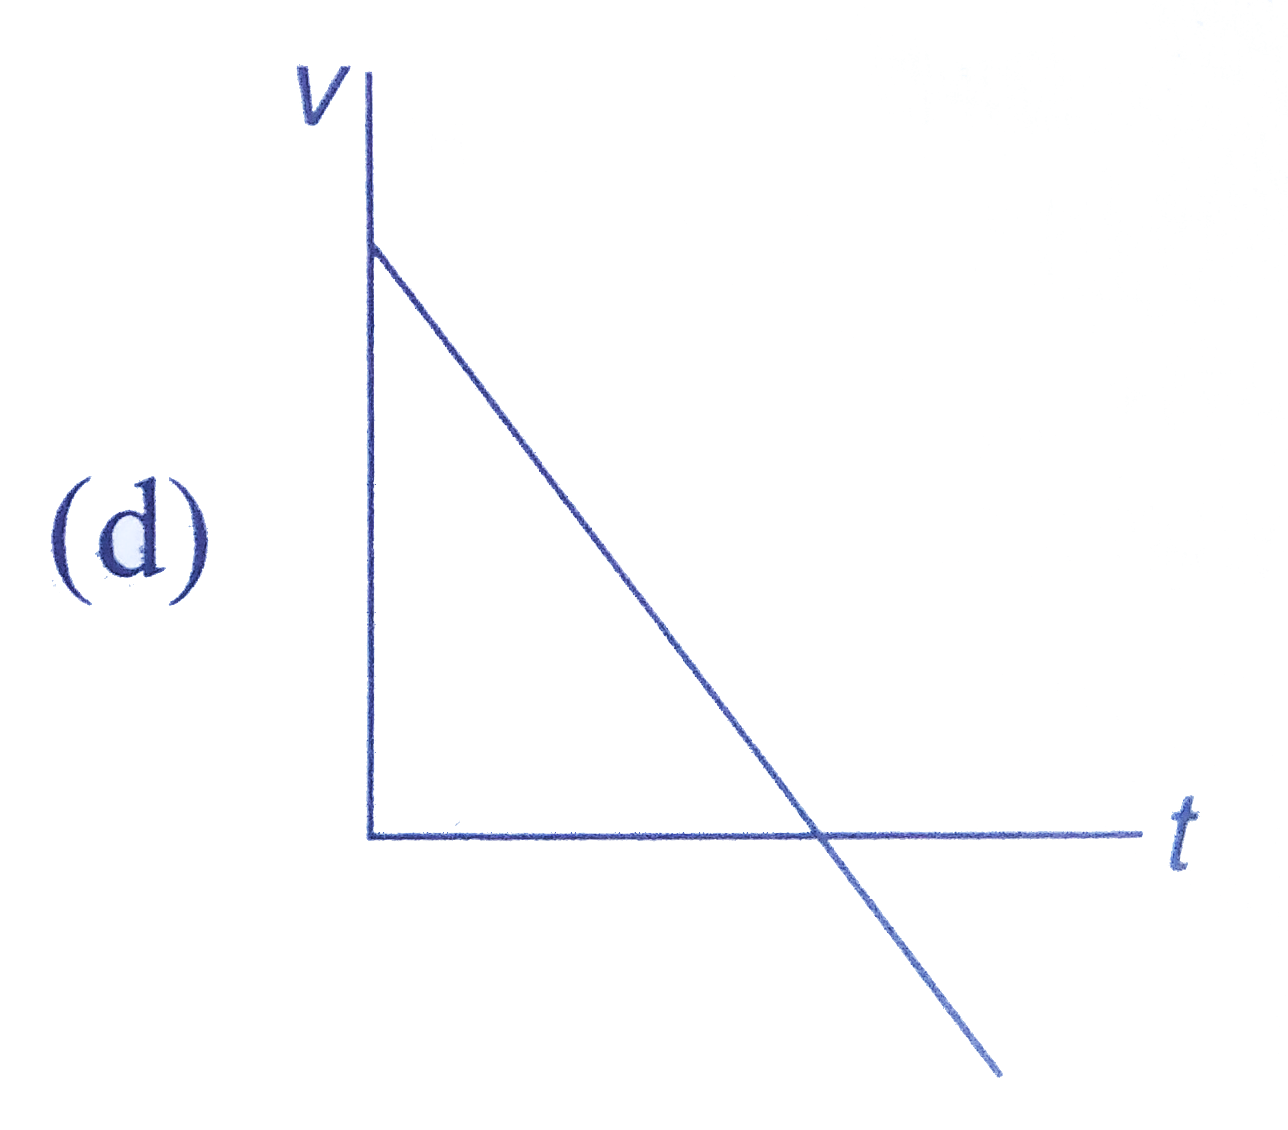 .
.Which of the following graphs relates V and T?
A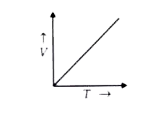 B
B C
C D
D
Figure shows volume - temperature (V-T) graph for same mass of an ideal gas at two different pressures P1and P2. Hence
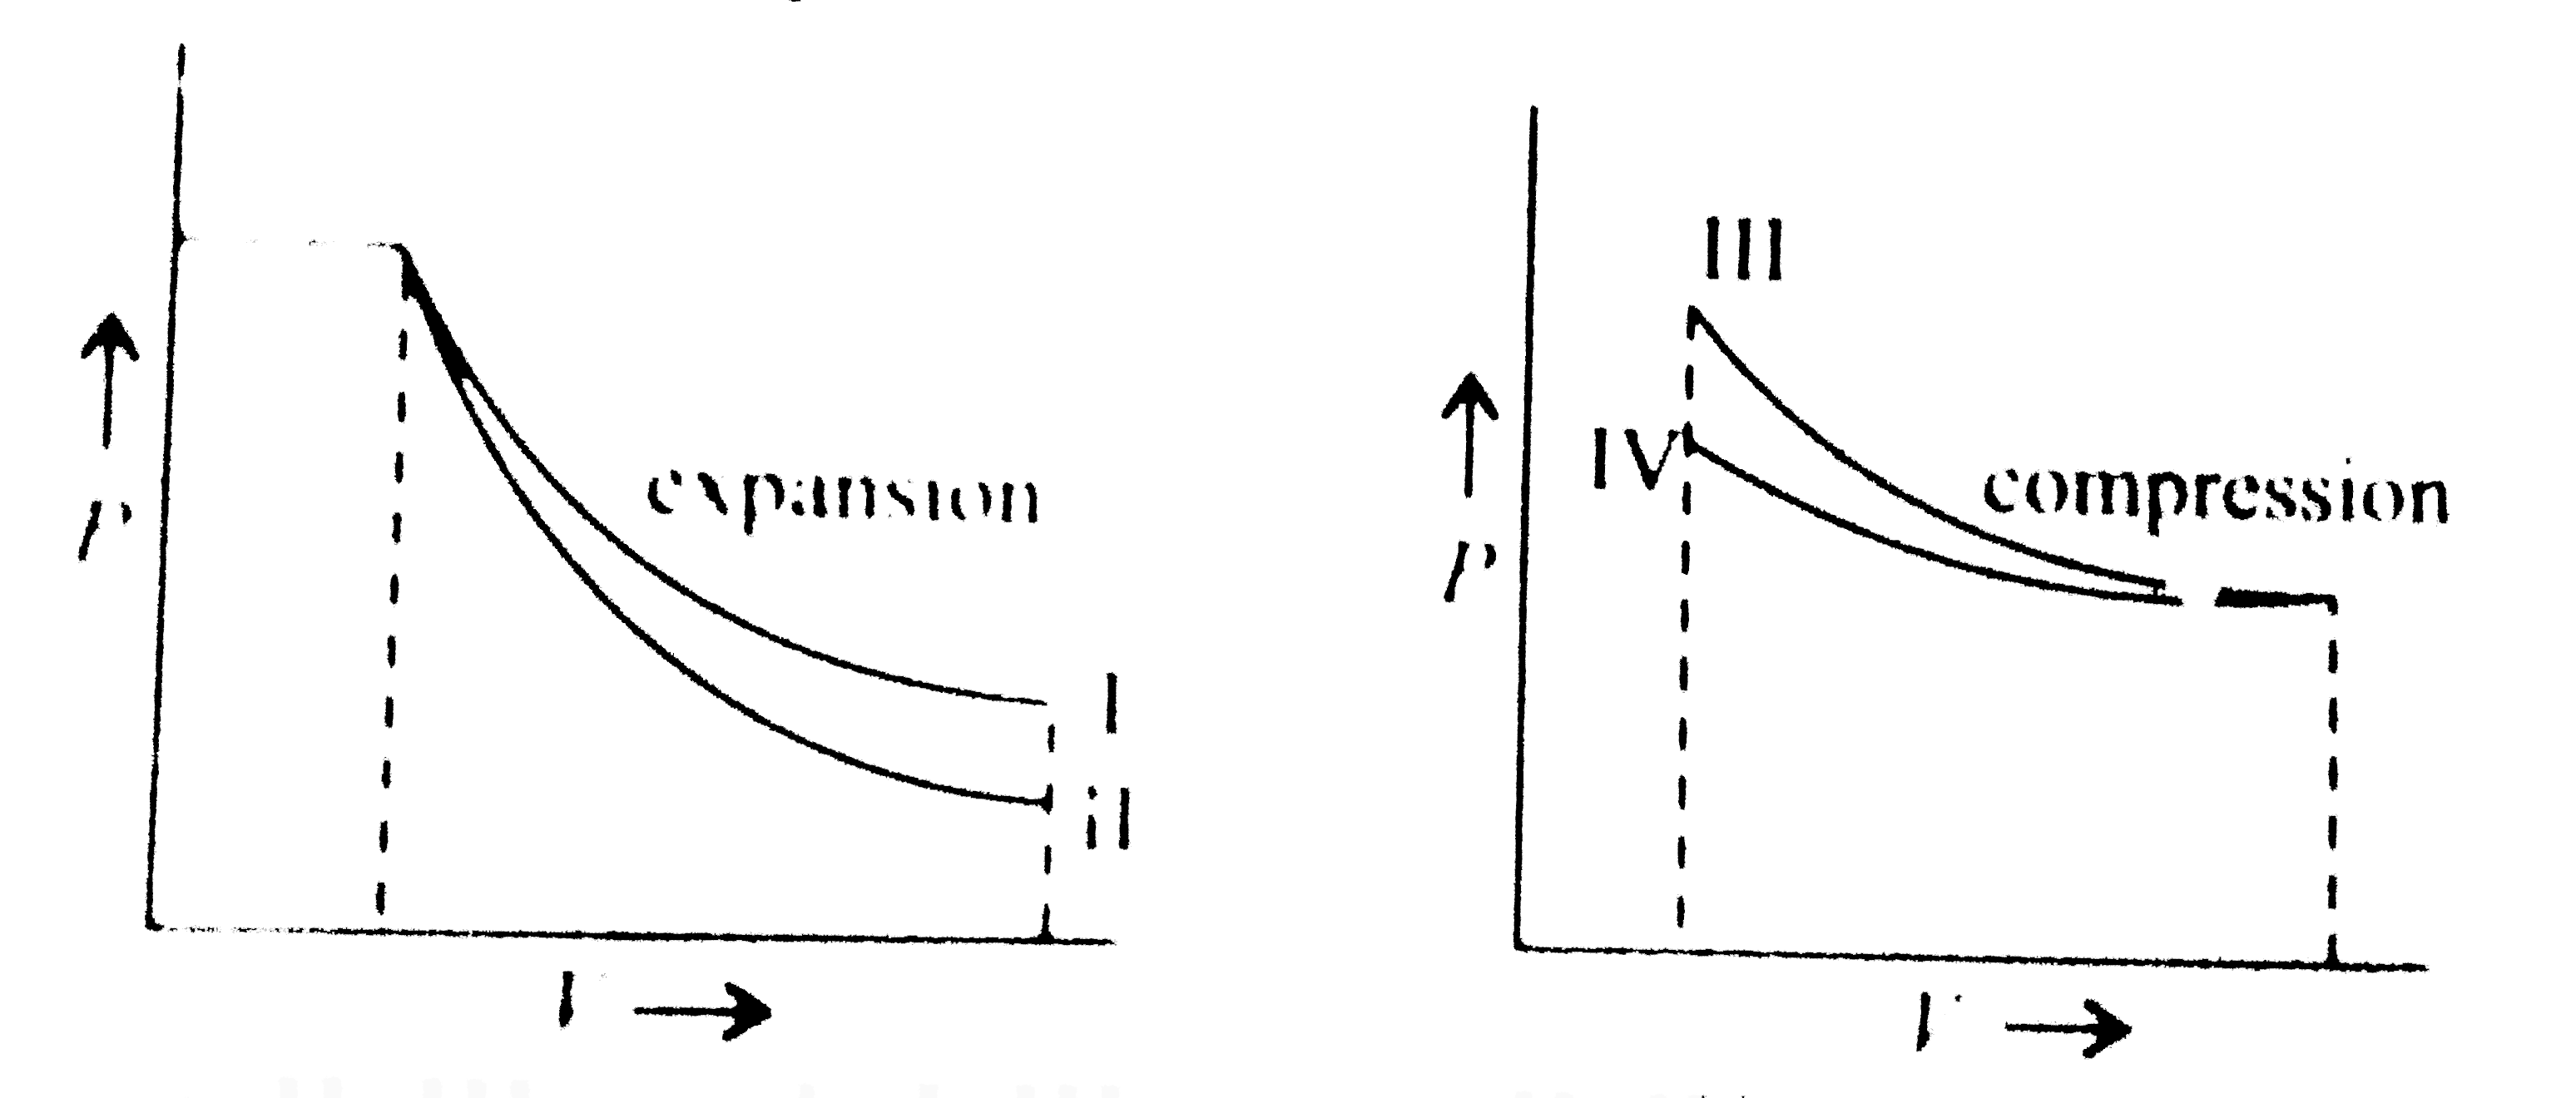
View SolutionWhich of the following graphs given below show (s) adiabatic process?
View SolutionWhich of the following P-V diagram represent the graph of isometric process?
View SolutionWhich of the following P-V diagram represent the graph of isometric process?
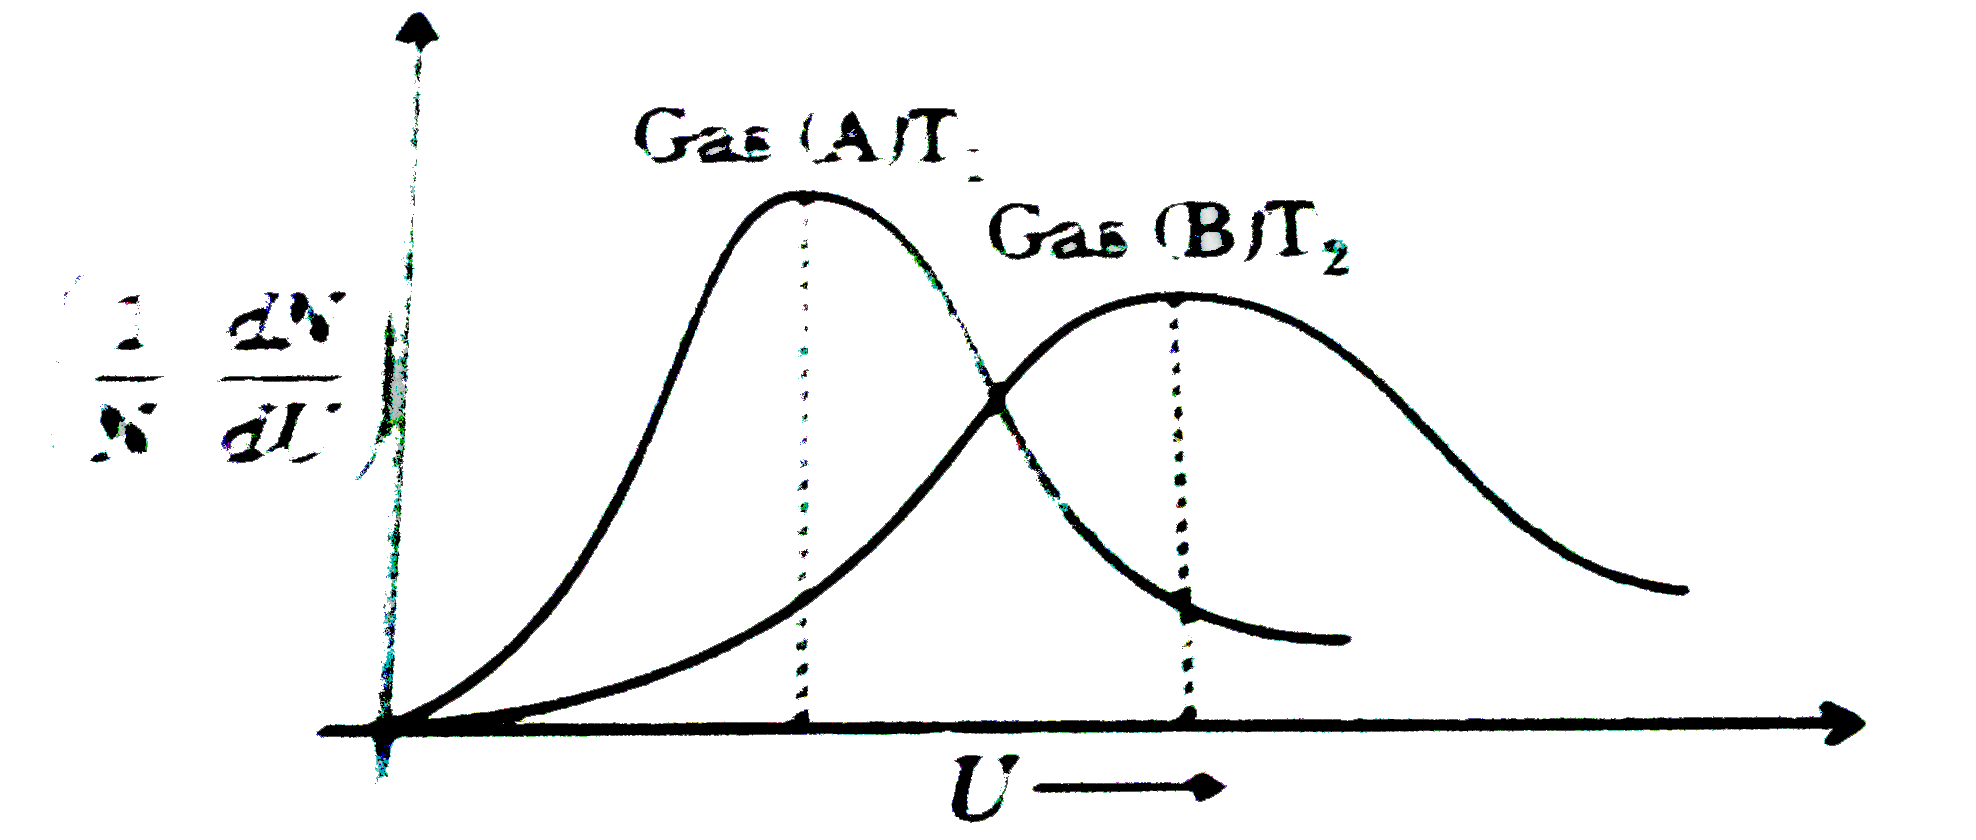
View SolutionFor the following graph, drawn from two different samples of gases at two different temperatures T1andT2, which of the following statements is/are necessarily true?
View Solution
