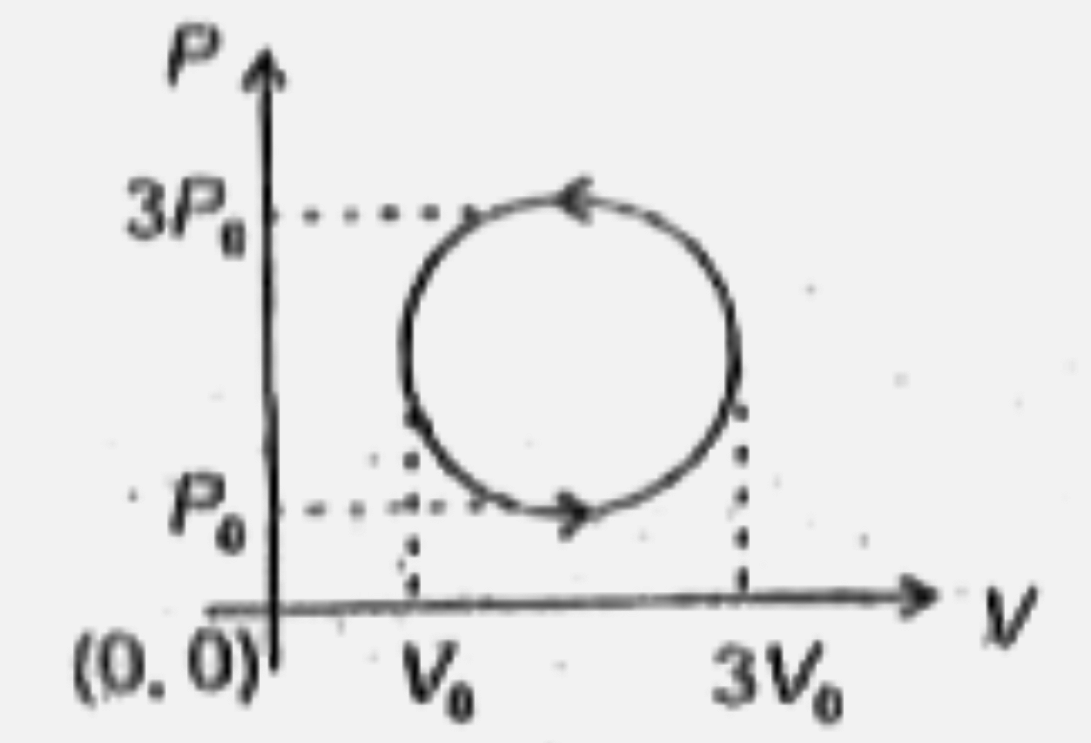
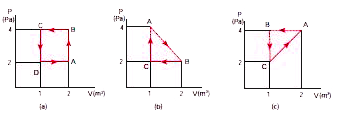
The PV diagrams for a thermodynamical system is given in the figure below. Calculate the total work done in each of the cyclic processes shown
Text Solution
In the case (a) the closed curve is anticlockwise. So the net work done is negative, implying that the work done on the system is greater than the work done by the system. The area under the curve BC will give work done on the gas (isobaric compression) and area under the curve DA (work done by the system) will give the total work done by the system.
Area under the curve BC=Area of rectangle BC12=1×4=−4J
Area under the curve DA=1×2+2J
Net work done in cyclic process
=−4+2=−2J
|
Topper's Solved these Questions
- HEAT AND THERMODYNAMICSBOOK - NCERT TAMILCHAPTER - HEAT AND THERMODYNAMICSEXERCISE - EVALUATION (MULTIPLE CHOICE QUESTIONS)
15 Videos
- HEAT AND THERMODYNAMICSBOOK - NCERT TAMILCHAPTER - HEAT AND THERMODYNAMICSEXERCISE - EVALUATION (Numerical Problems)
13 Videos
- GRAVITATIONBOOK - NCERT TAMILCHAPTER - GRAVITATIONEXERCISE - ADDITIONAL EXERCISES
4 Videos
- KINEMATICSBOOK - NCERT TAMILCHAPTER - KINEMATICSEXERCISE - EXERCISE (IV. Exercises )
20 Videos
Similar Questions
Knowledge Check
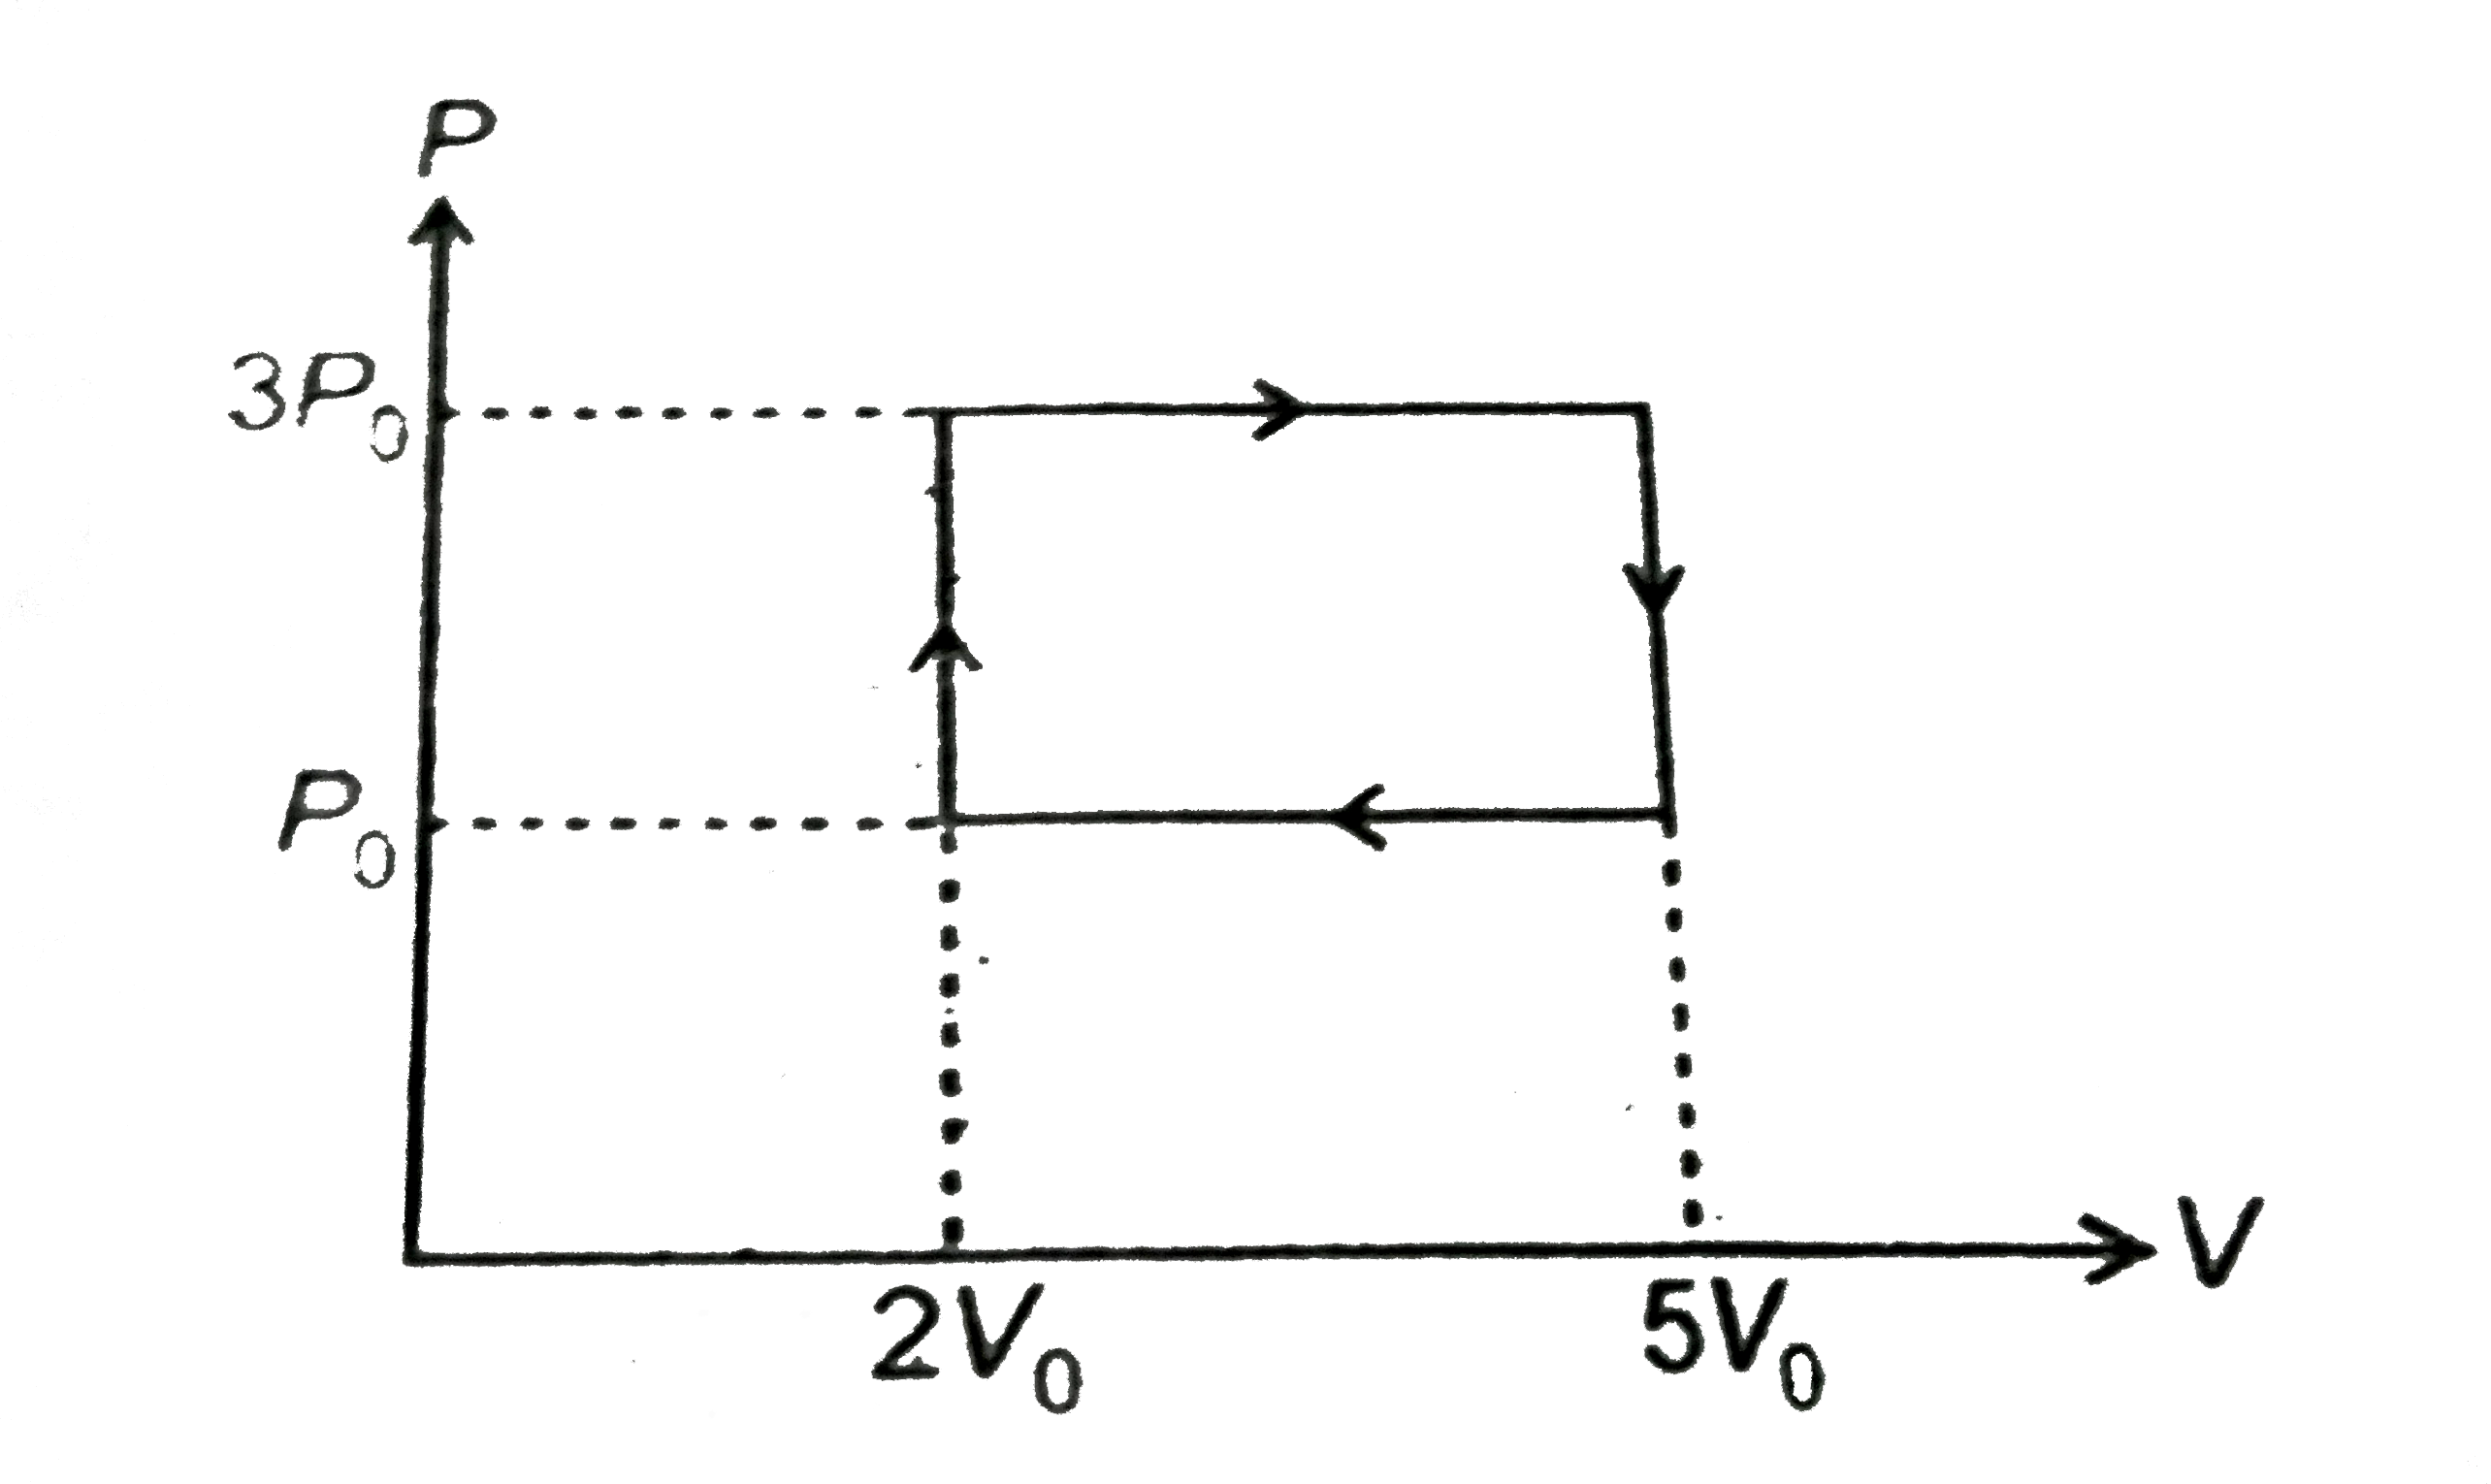
Work done in the cyclic process shown in figure is-
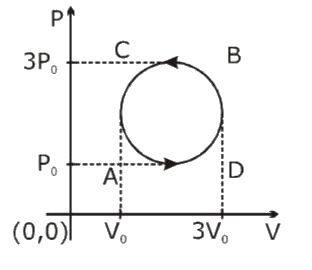 A4P0V0B−4P0V0C−227P0V0D−13P0V0
Find the work done by gas going through a cyclic process shown in figure?
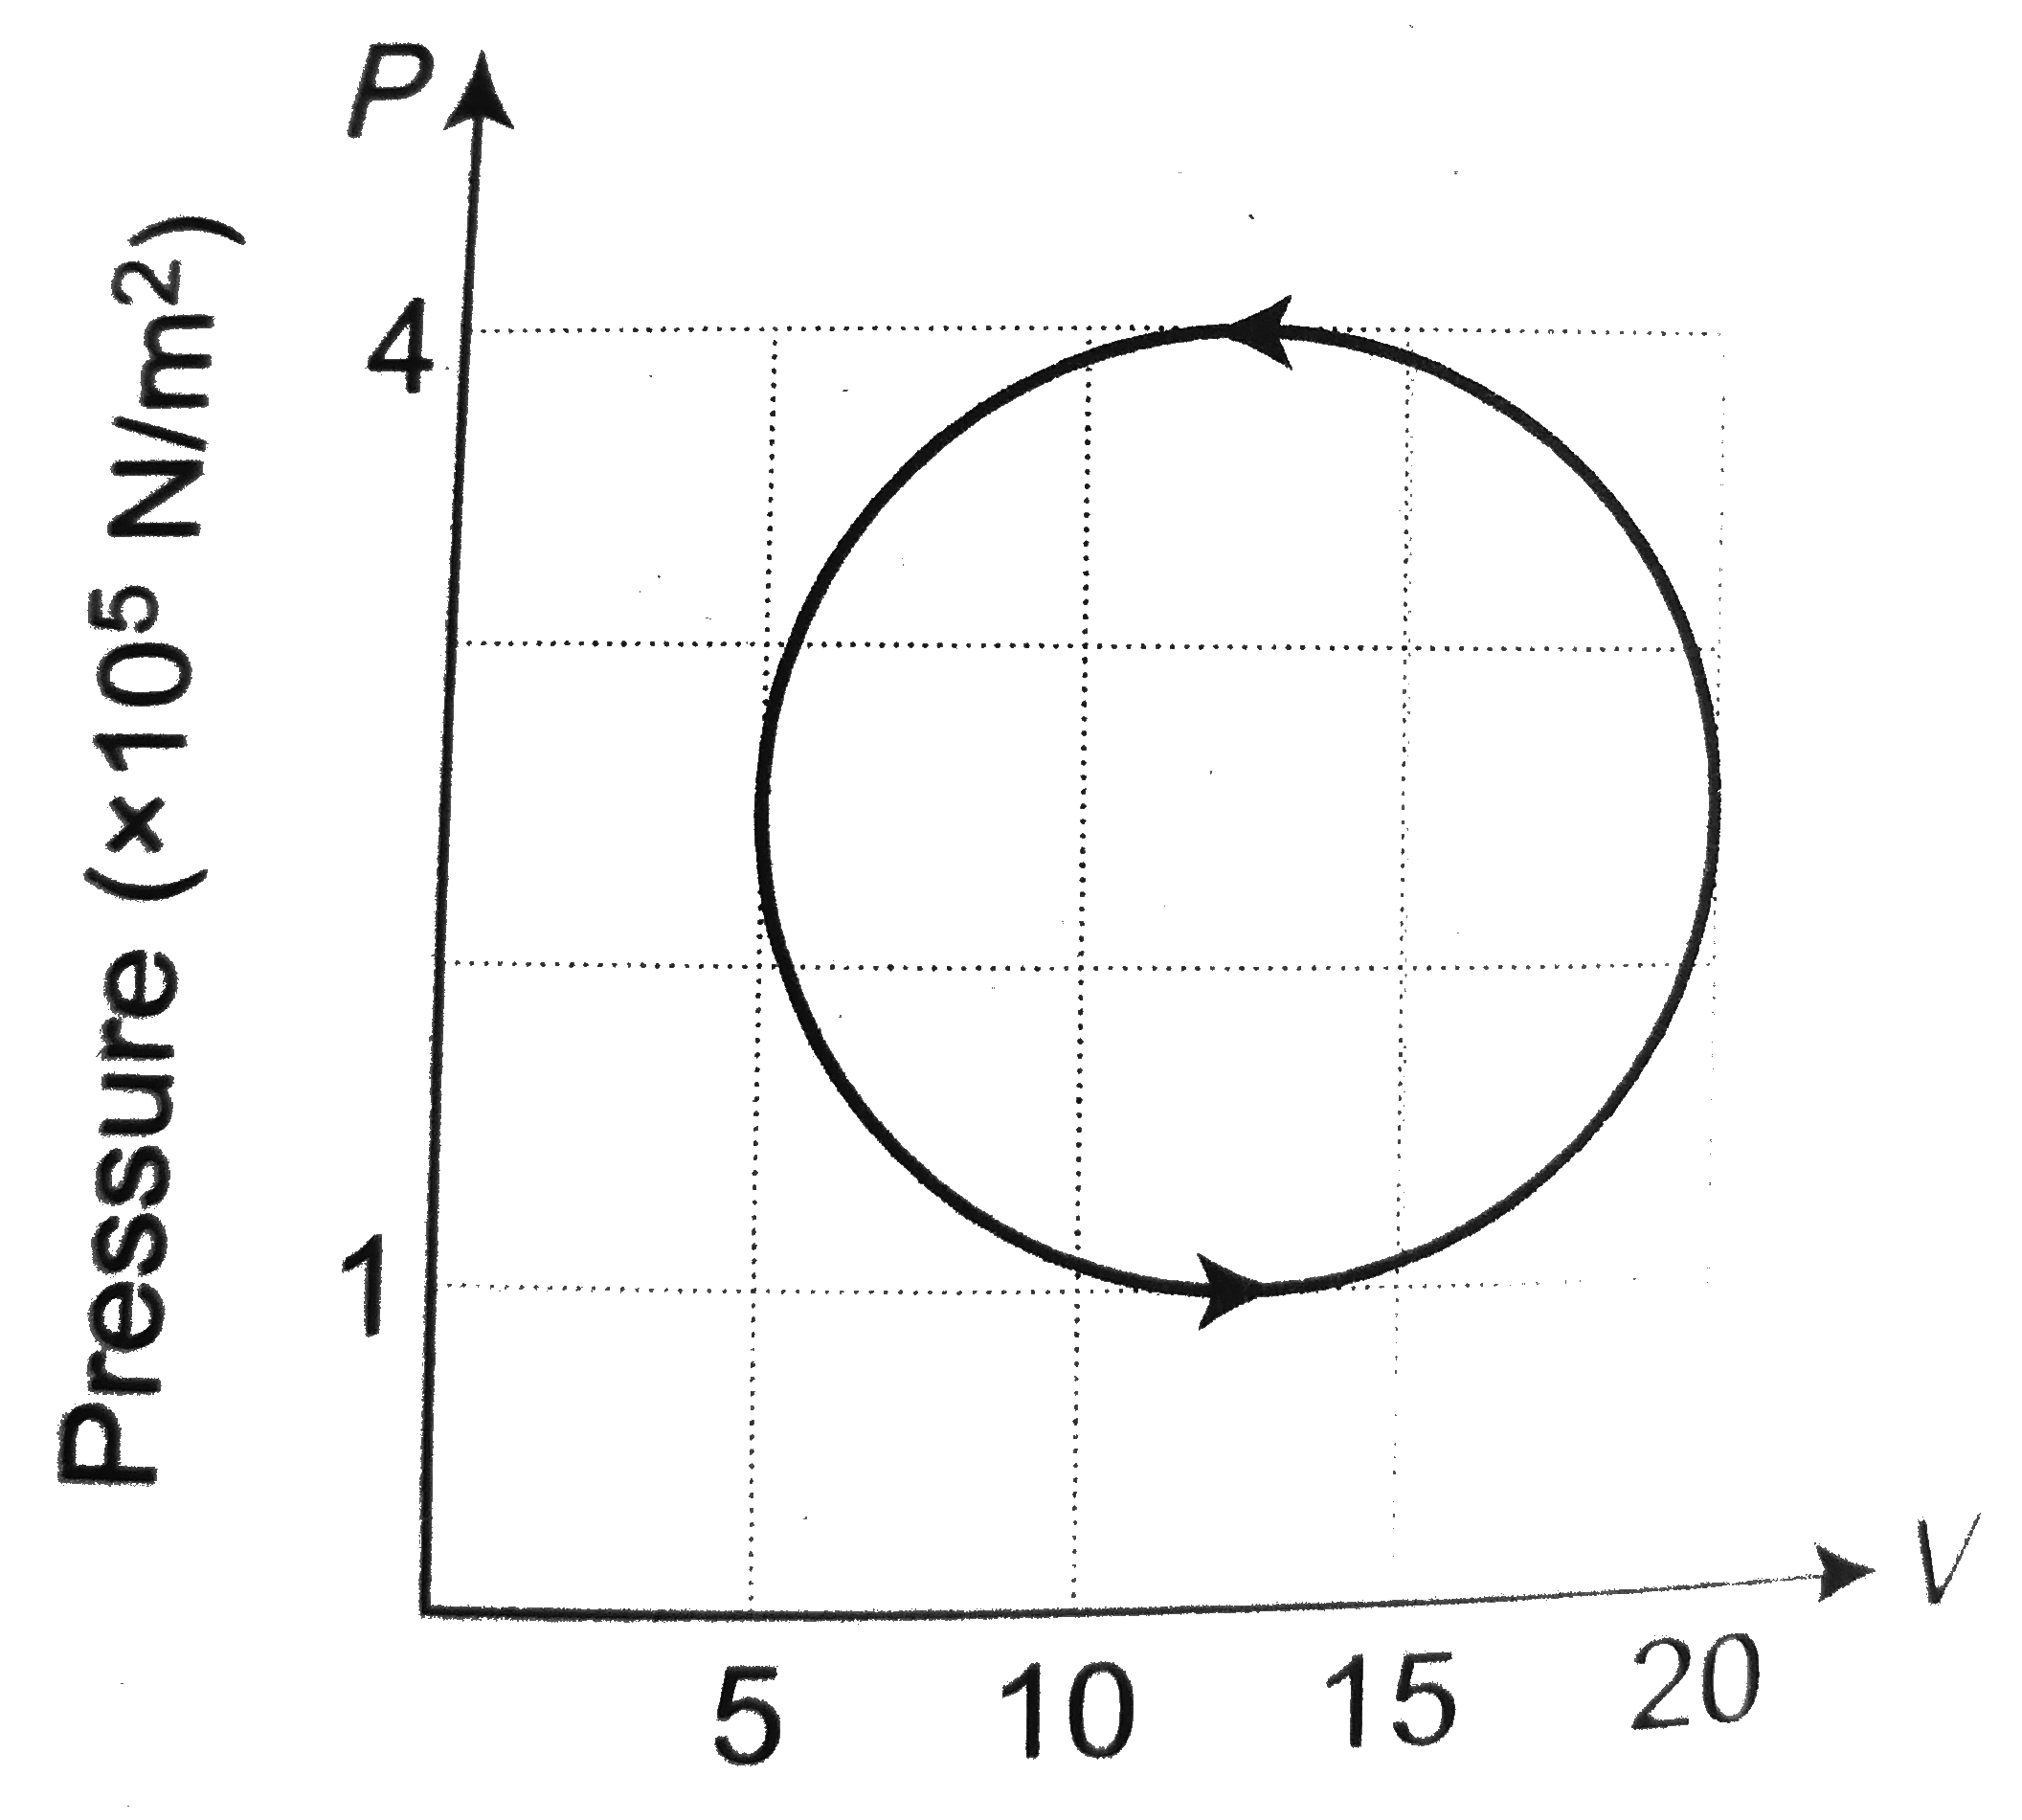 A−225π2kJB−125π2kJC−200π3kJD−325π3kJ
Work done in given cyclic process is
View SolutionWork done in given cyclic process is

View SolutionFind the work done by gas going through a cyclic process shown in figure?

View SolutionFind the work done by gas going through a cyclic process shown in figure?

View Solution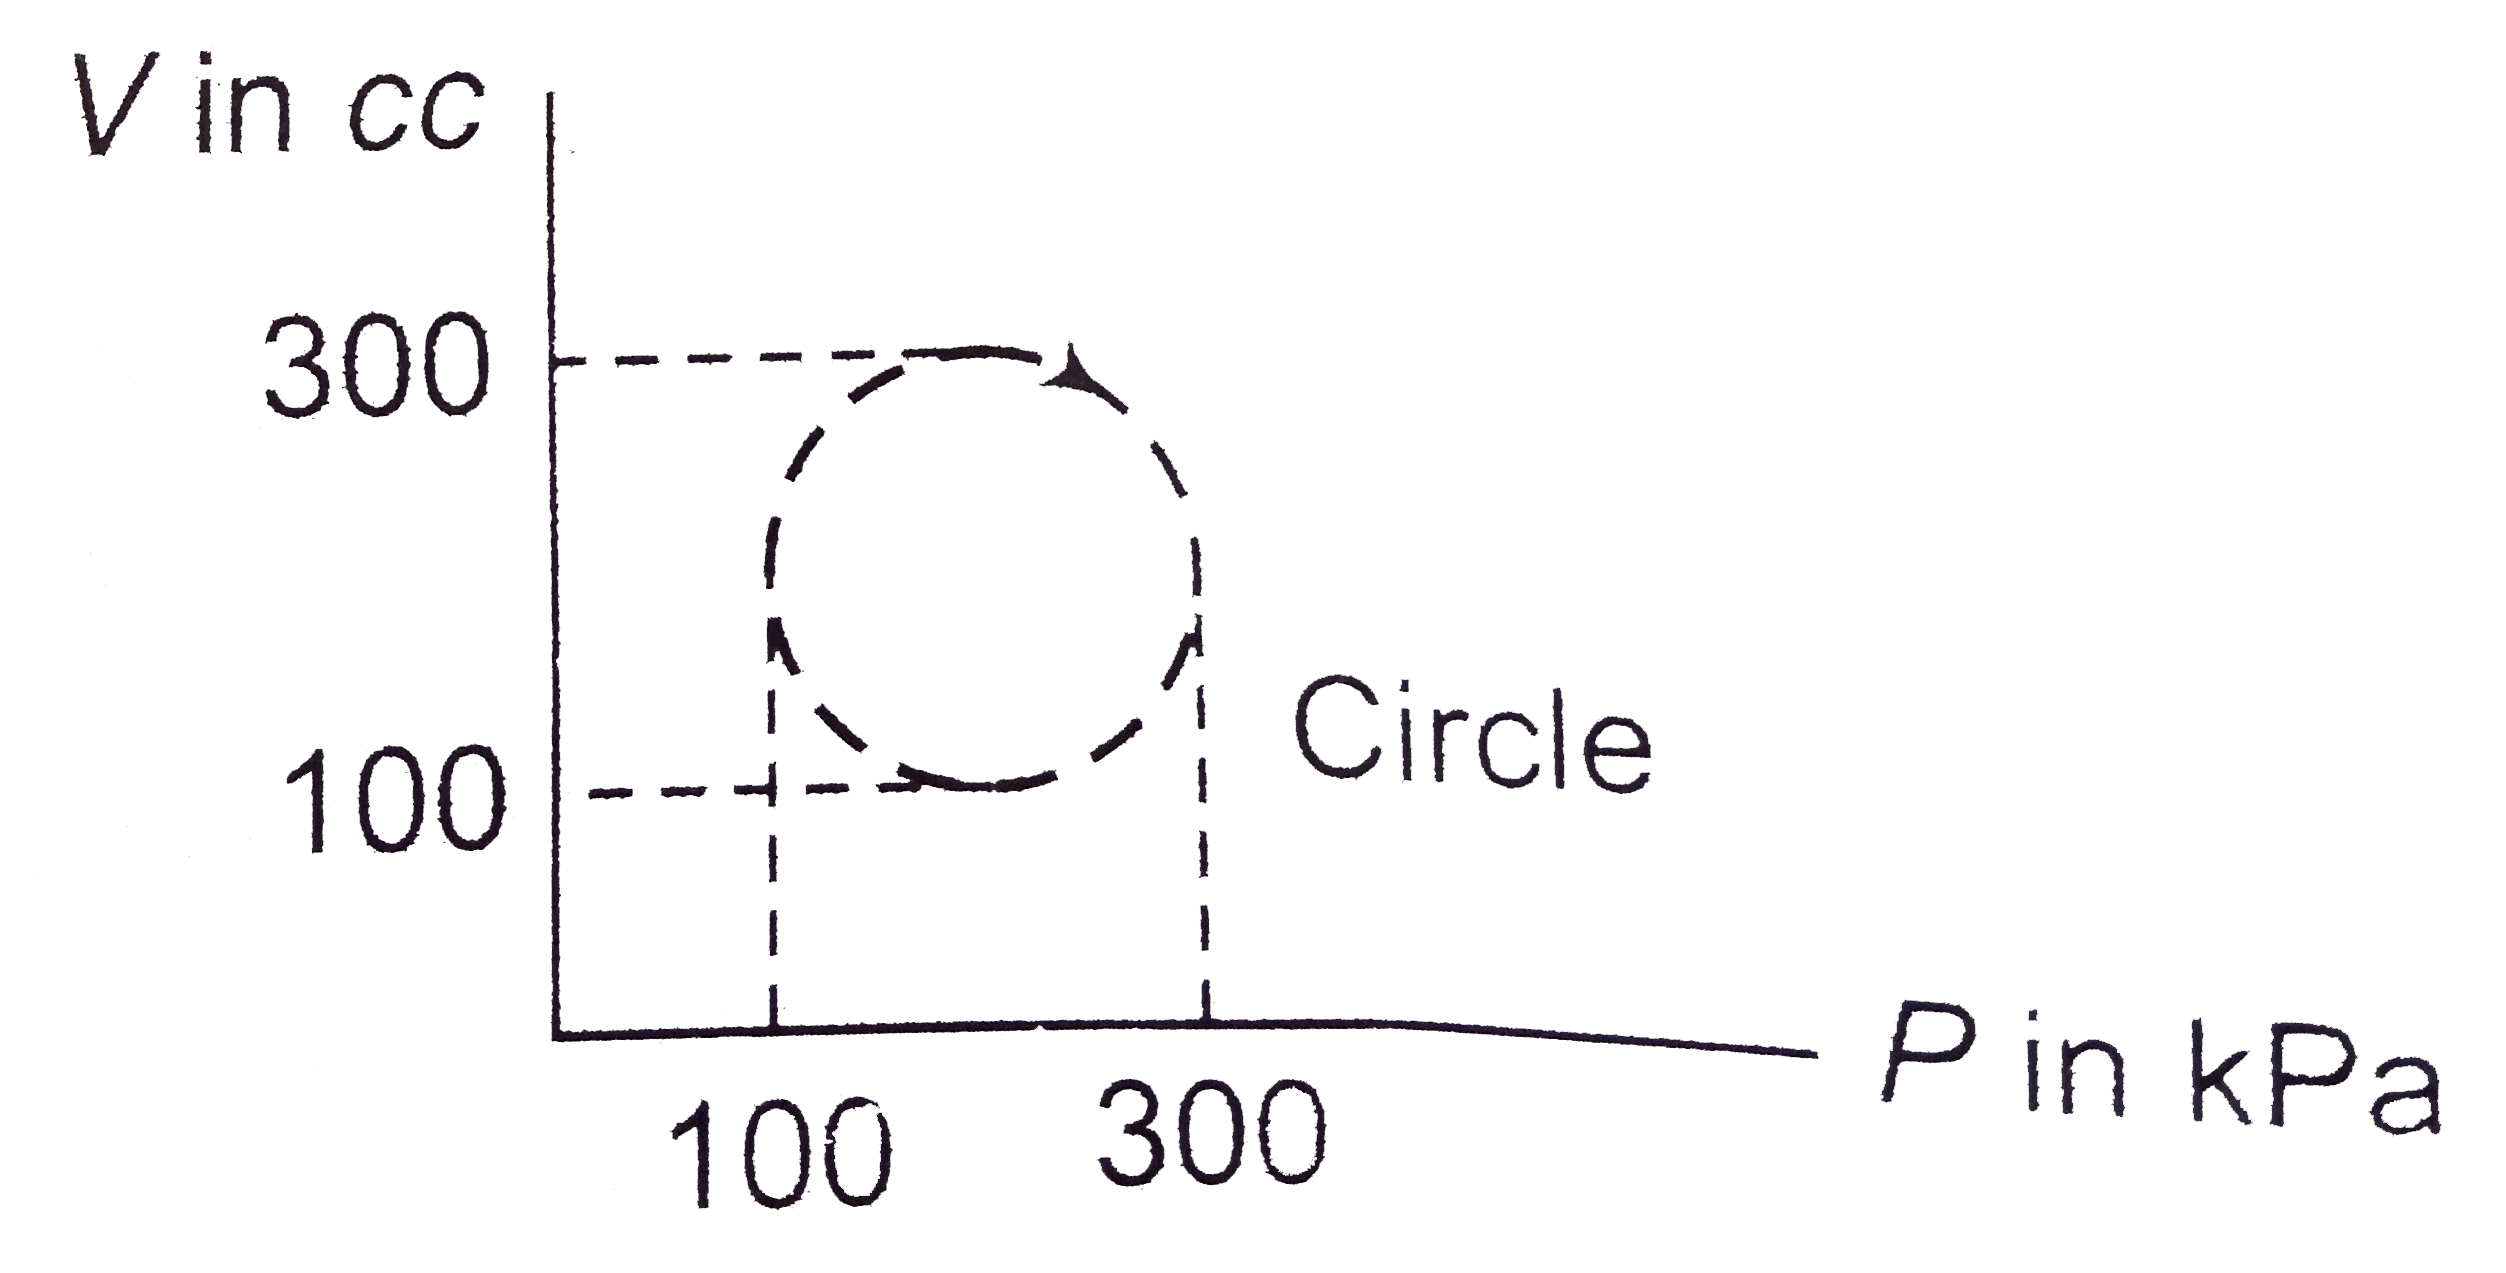
Calculate the heat rejected by a system in going through the cyclic process shown in figure.
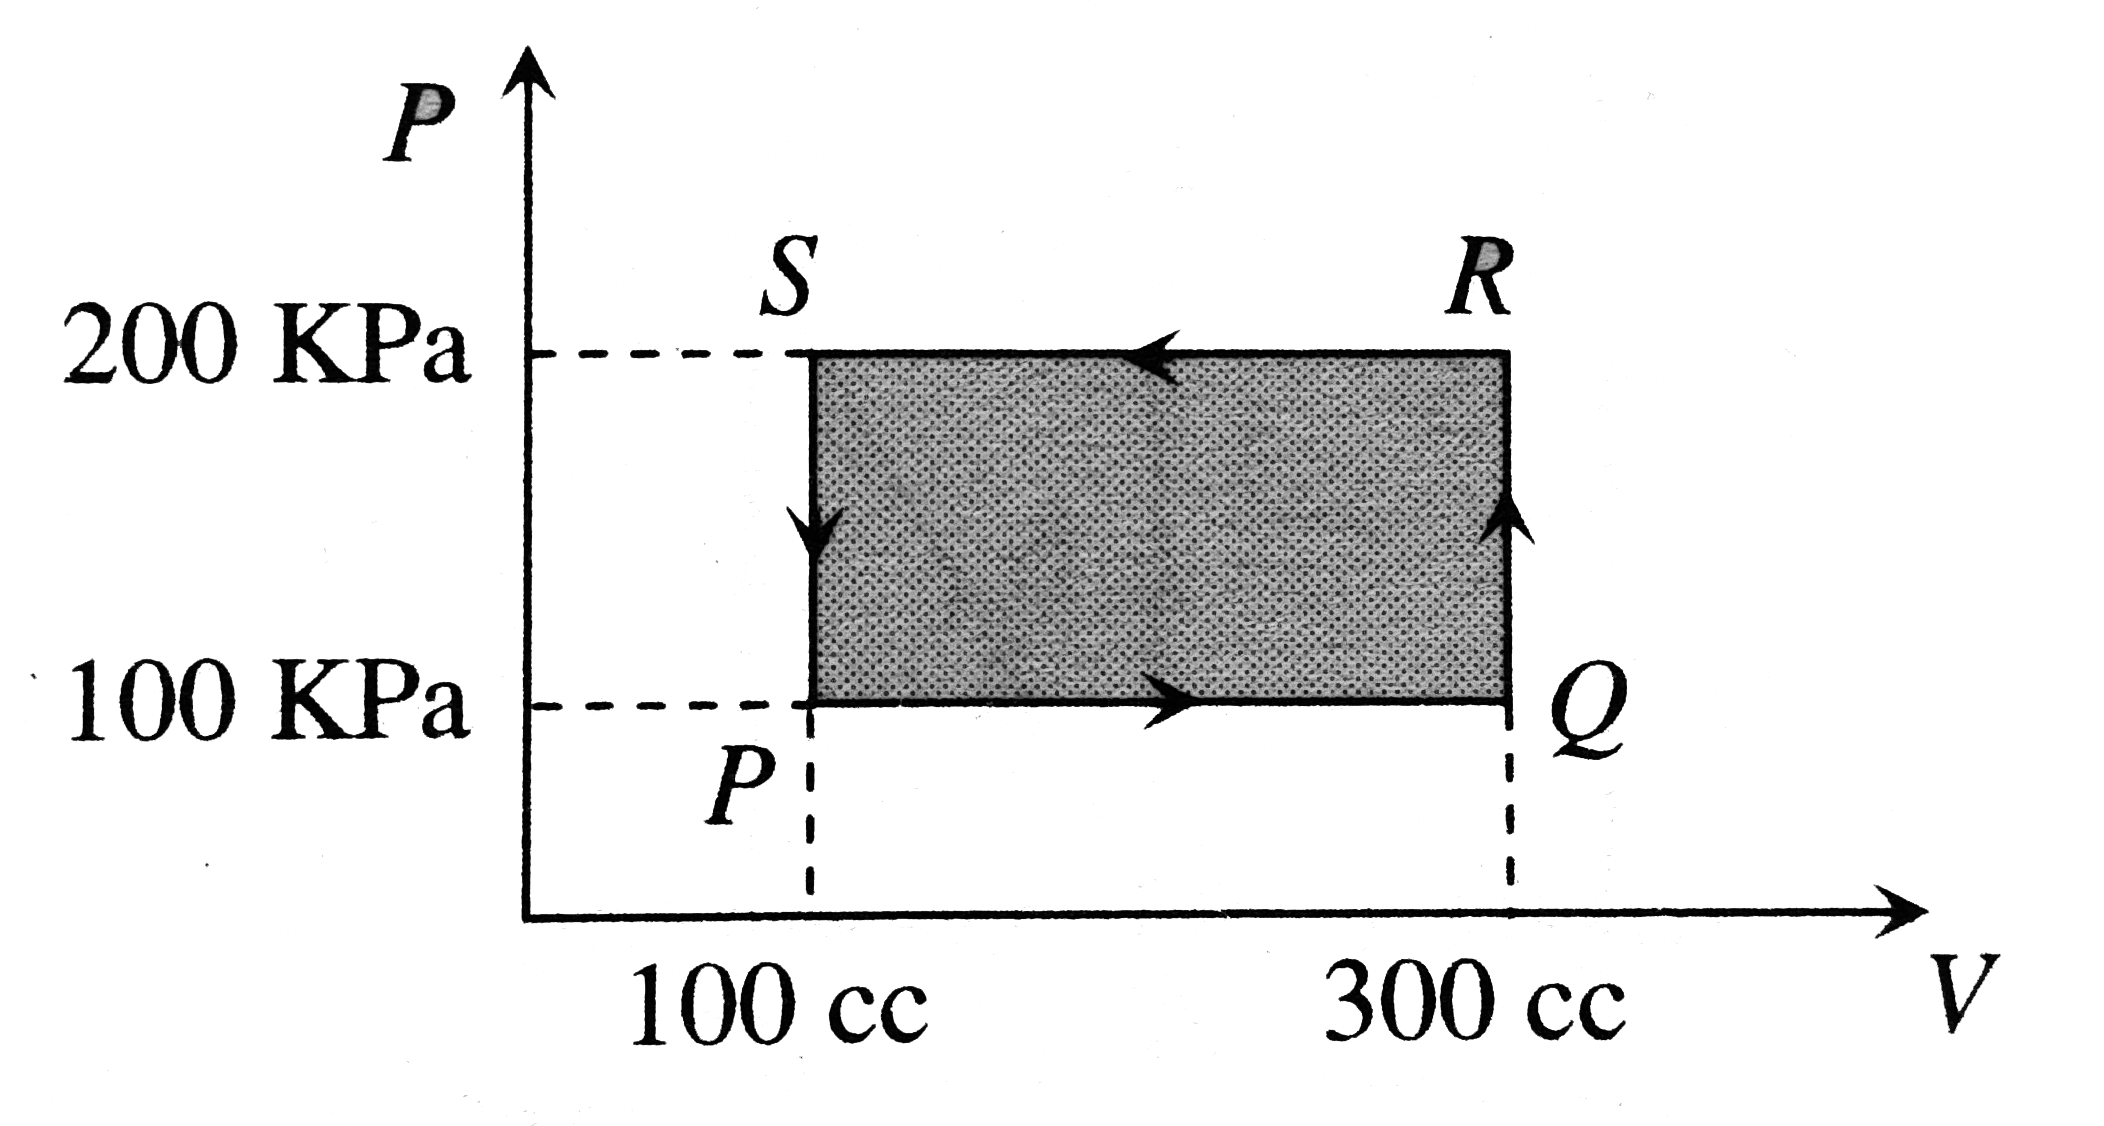
View SolutionA thermodynamic system is taken through the cyclic PQRSP process. The net work done by the system is
View Solution

