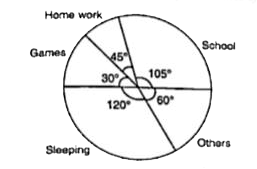
The number of hours spent by a school student on various activities on a working day is given below. Construct a pie chart.

1. Find the percentage of sleeping hours.
2. By what angle is home work more than play?
3. By what angle are other activities less than sleep ?
The correct Answer is:45∘ less than sleep.
Similar Questions
The number of hours spent by a school boy in different activities in a day is given below :

Represent the above information using a pie diagram.
View SolutionThe number of hours spent by a school boy in different activities in a day is given below:

Represent the above information using pie diagram.
View Solution
Knowledge Check
A pie diagram represents the number of hours spent by a school boy in different activites in a day. If 7 hours are spent in school, then what is the measure of the central angle?
A210∘B105∘C52.5∘D90∘The following pie chart shows the hourly distribution of all the major activities of a student.

What is the difference in time (in hours) spends in school and in home work :A2B3C4D8
The number of hours, spent by a school boy on different activities in a working day, is given below: Activities : Sleep, School, Home, Play, others, Total No. Of hours : 8,7,4,2,3,24 Present the information in the form of a pie-chart.
View SolutionThe number of hours, spent by a school boy on different activities in a working day, is given below: Activities, Sleep, School, Home, Play, others, Total No. Of hours, 8, 7, 4, 2, 3, 24 Present the information in the form of a pie-chart.
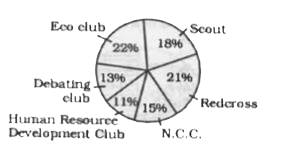
View SolutionThe pie-chart given below shows the number of students enrolled in a school in different activities. Total number of students in the school is 1200. Study the chart and answer the questions.

What is the ratio of number of students enrolled in Scout and Redcross activities together to those enrolled in Debating Club activities ?
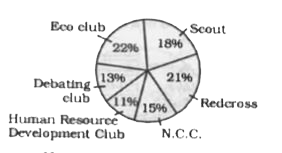
View SolutionThe pie-chart given below shows the number of students enrolled in a school in different activities. Total number of students in the school is 1200. Study the chart and answer the questions.

The number of students enrolled in Eco-club is what per cent of those enrolled in Redcross activities ?
View SolutionThe number of hours for which students of a particular class watched television during holidays is shown through the given graph.Answer the following.(i) For how many hours did the maximum number of students watch TV?(ii) How many students watched TV for less than 4 hours?(iii) How many students spent more than 5 hours in watching TV?
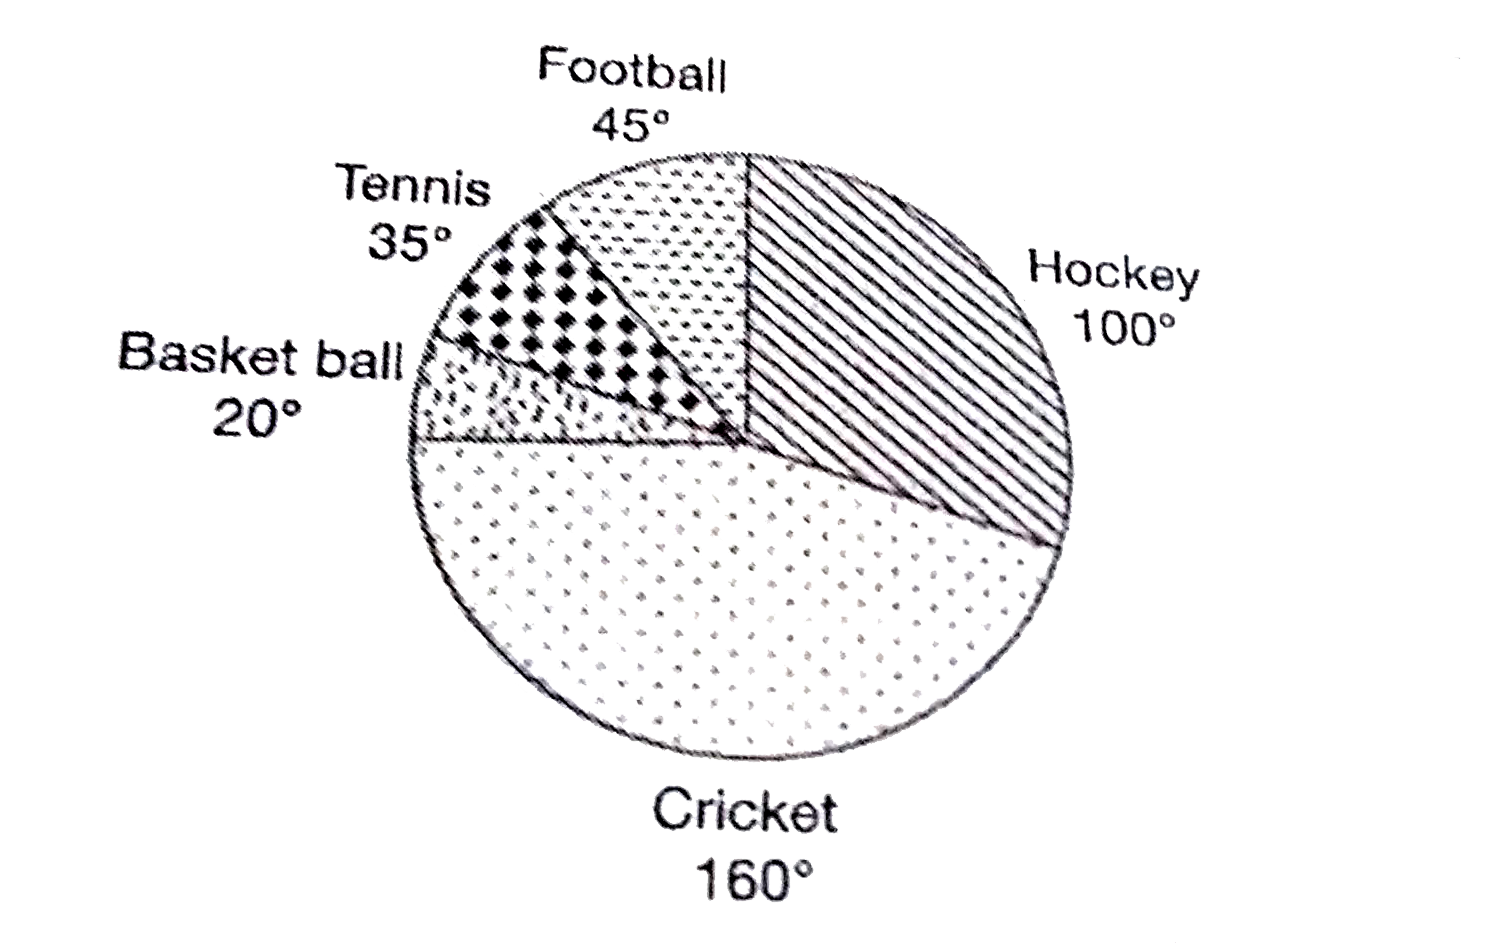
View SolutionThe given pie chart shows the amount of money spent by a school on various sports in the year 2015.

Study the pie chart carefully and answer the following question.
(i) If the amount spent on football was Rs. 9000, then how much more money was spent on hockey than on football ?
(ii) If the amount spent on football Rs. 9000, then what was the total amount spent on all sports ?
View Solution
