The graphical representation of grouped data is_________
A
bar graph
B
pictograph
C
pie chart
D
histogram
Text Solution
The correct Answer is:D
|
Similar Questions
Knowledge Check
Which of the following is shown a graphical representation of cumulative frequency data ?
AHistogramBFrequency polygonCCumulative (ogive)DPie-chart
This graphical representation specifics

View SolutionGraphical Representation For Motion
View SolutionGraphical representation of cartesian product
View SolutionIn a frequency distribution, ogives are graphical representation of (a) Frequency (b) Relative frequency (c) Cumulative frequency (d) Raw data
View SolutionGive a graphic representation of the C3 cycle.
View SolutionGraphical Representation OF Accelerated Motion
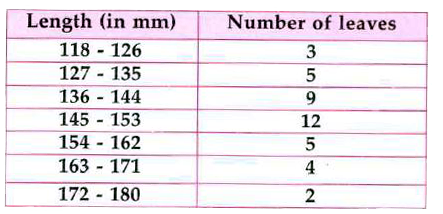
View SolutionThe length of 40 leaves of a plant are measured correct to one millimetre, and the obtained data is represented in the following table:

Is there any other suitable graphical representation for the same data?
View Solution
