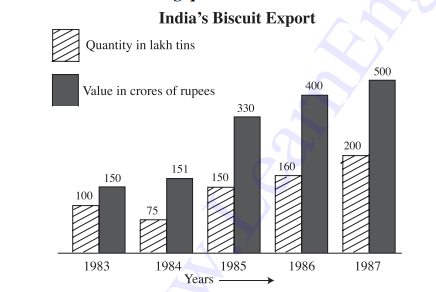
Study the following graph carefully and answer the following questions -----
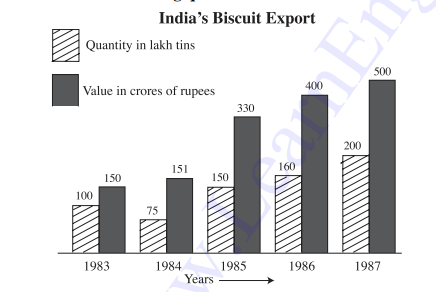
What was the approximate per cent increase in export value from 1983 to 1987 ?
350
330
43
233
Step by step video, text & image solution for Study the following graph carefully and answer the following questions ----- What was the approximate per cent increase in export value from 1983 to 1987 ? by Maths experts to help you in doubts & scoring excellent marks in Class 14 exams.
Updated on:21/07/2023Topper's Solved these Questions
Similar Questions
Study the following graph carefully and answer the given questions.
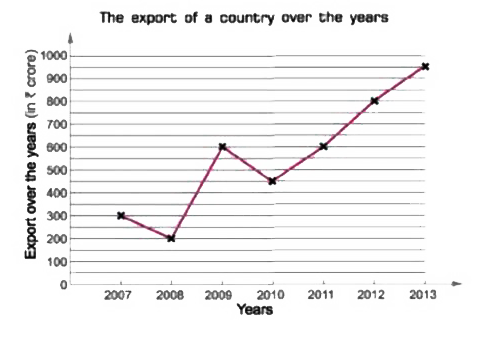
Which year has the highest per cent increase/decrease in exports as compared to the preceding year ?
View SolutionStudy the following graph carefully and answer the given questions.
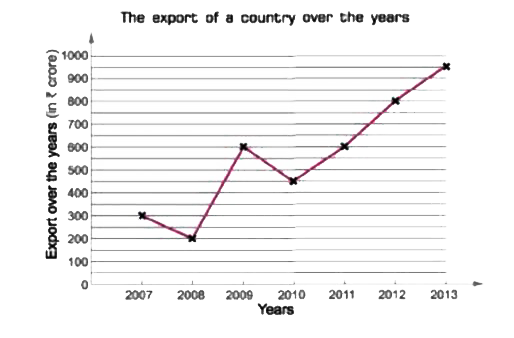
What is the percentage increase in exports from the lowest to the highest for the given years ?
View Solution
Knowledge Check
Study the following graph carefully and answer the following questions -----
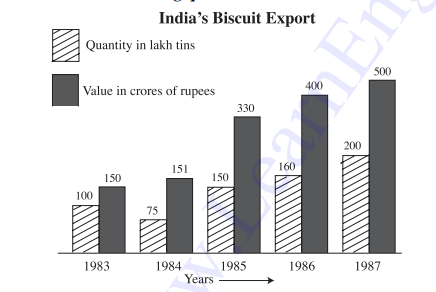
What was the percentage drop in export quantity from 1983 to 1984 ?A75BNilC25D50Study the following graph carefully and answer the following questions -----
In which year the value per tins was minimum ?A1983B1984C1985D1986Study the following graph carefully and answer the questions given below it -----
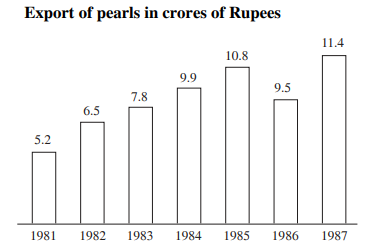
What was the percentage increase in export from 1986 to 1987 ?A1623%B20%C19%D3313%
Study the following graph carefully and answer the following questions -----
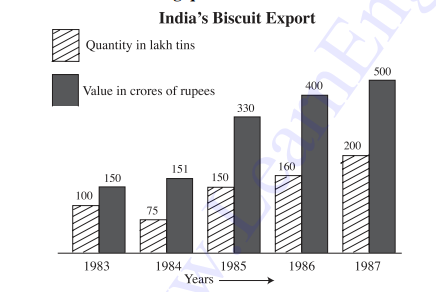
What was the difference between the tins exported in 1985 and 1986 ?
View SolutionStudy the following graph carefully and answer the questions that
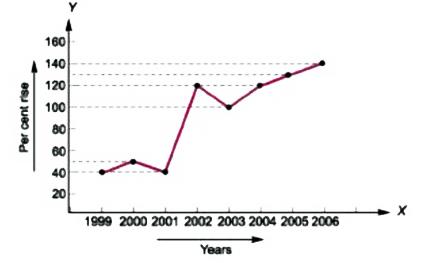
What was the average of percent rise over the given years ?
View SolutionStudy the following graph carefully to answer the questions given below.
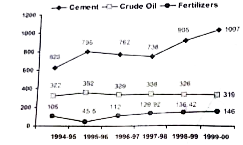
Find the approximate percentage increase in Cement production from 1994-95 to 1999-00 ?
View SolutionStudy the table carefully to answer the following questions ----
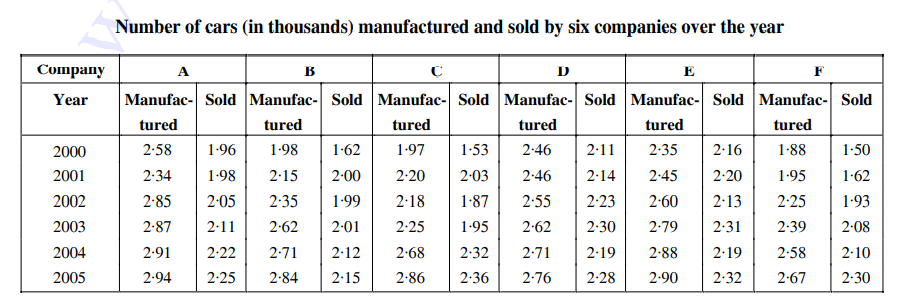
What is the approximate percent increase in the number of cars sold by company F in the year 2004 from the previous year ?
View SolutionStudy the following graph carefully and answer the given questions.
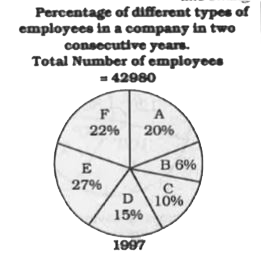
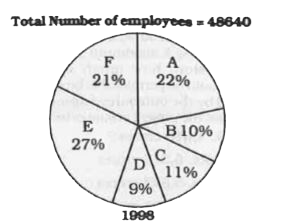
What was the approximate difference in the number of B type of employees during 1997 and 1998 ?
View Solution
