Study the following graph carefully and answer the questions given below –
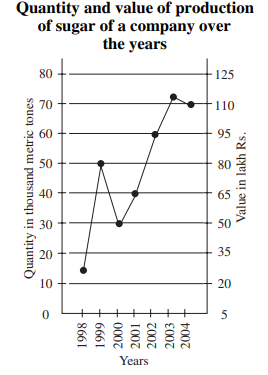
What was the difference between the average production of sugar during the average production of sugar during the year 1998, 1999, 2000 and 2001 and that of 2001, 2002, 2003 and 2004 in thousand metric tons?
15
20
25
None of these
The correct Answer is:D
Step by step video, text & image solution for Study the following graph carefully and answer the questions given below – What was the difference between the average production of sugar during the average production of sugar during the year 1998, 1999, 2000 and 2001 and that of 2001, 2002, 2003 and 2004 in thousand metric tons? by Maths experts to help you in doubts & scoring excellent marks in Class 14 exams.
Updated on:21/07/2023Topper's Solved these Questions
Similar Questions
Read the following graph carefully and answer the questions given below:
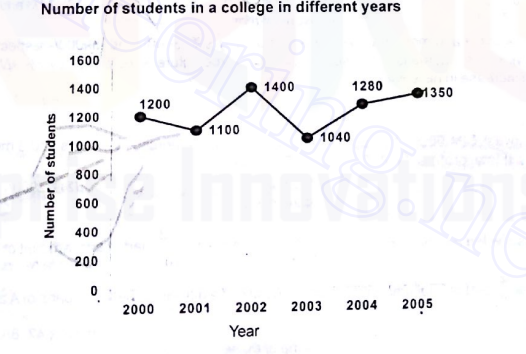
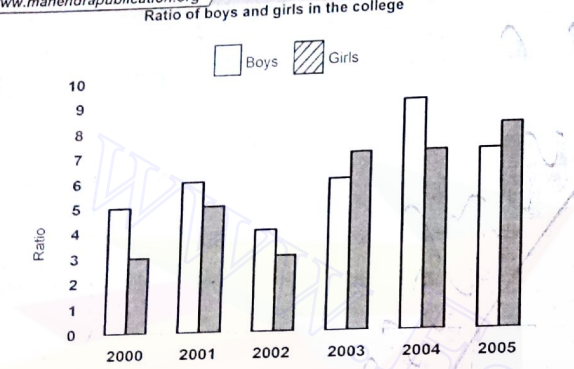
What is the difference between the number of boys and girls in the year 2004 ?
View SolutionStudy the following graph and answer the questions given below it.
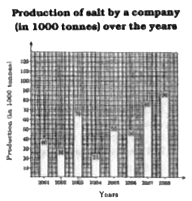
What was the percentage decline in the product of salt from 2003 to 2004 ?
View Solution
Knowledge Check
Study the following graph carefully and answer the question given below-----
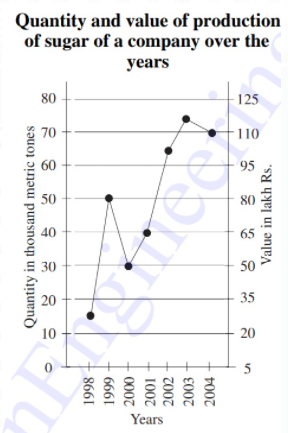
What was the difference between the average production of sugar during the years 1998,1999,2000 and 2001 and that of 2001,2002,2003 and 2004 in thousand metric tons ?A15B20C25DNone of theseStudy the following graph carefully to answer the questions given below.
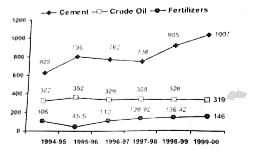
What is the difference between the average cement production and the average crude oil production during the given years (in lakh tonnes)?A474B460C560D469Study the following graph carefully and answer given below ------
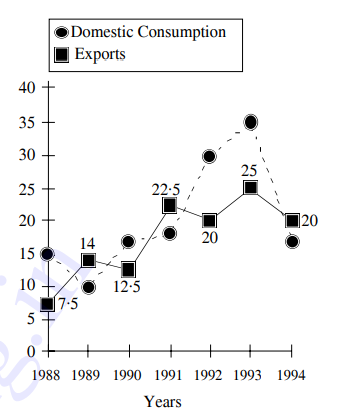
What was the difference between the average domestic consumption and the average exports of the given years ?A2000 tonnesB3000 tonnesC2500 tonnesDNone of these
Study the following graph and answer the questions given below it.
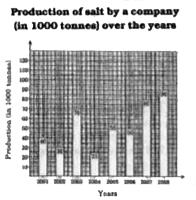
In how many of the given years was the production of salt more than the average production of the given years?
View SolutionStudy the following graph and answer the questions given below it.
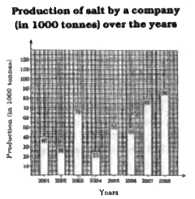
What was the percentage increase in production of salt in 2008 compared to that of 2001 ?
View SolutionStudy the following graph carefully and answer the questions -----
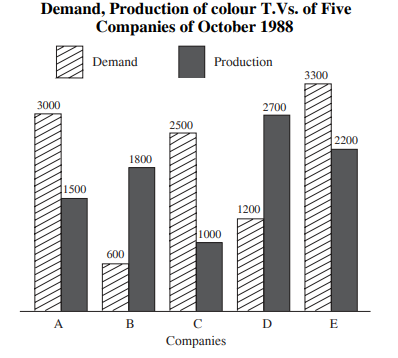
What is the difference between average demand and average production of the five companies taken together ?
View SolutionStudy the following graph carefully and answer the questions given below it -----
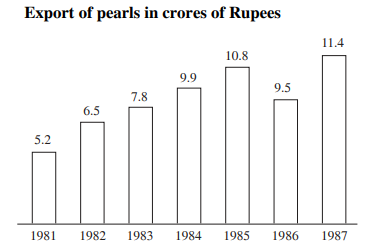
In how many years was the export above the average for the given period ?
View SolutionStudy the following graph and answer these questions given below:-
Tea in India (in million kg.)
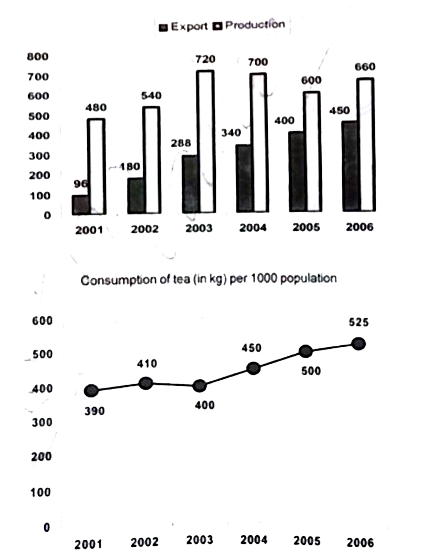
What was approximately the average production during the period?
View Solution
