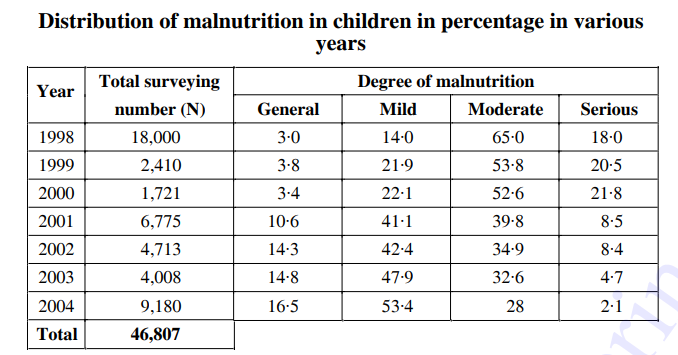
The following questions depends on the table given below-
Distribution of malnutrition in children in percentage in various

In which of the following years there was most improvement in degree of malnutrition in comparison of previous year?
2000
2001
2002
2003
The correct Answer is:B
Step by step video, text & image solution for The following questions depends on the table given below- Distribution of malnutrition in children in percentage in various In which of the following years there was most improvement in degree of malnutrition in comparison of previous year? by Maths experts to help you in doubts & scoring excellent marks in Class 14 exams.
Updated on:21/07/2023Topper's Solved these Questions
Similar Questions
The following questions depends on the table given below-
Distribution of malnutrition in children in percentage in various
How many cases were moderate and serious malnutrition together in the surveying in 1998?
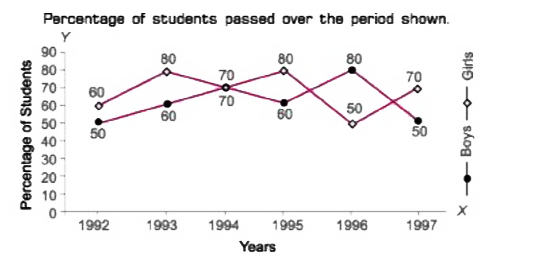
View SolutionStudy the following graph carefully and answer the questions that follow

In which of the following years was the improvement of girls maximum as compared to that of previous years ?
View Solution
Knowledge Check
The following questions depends on the table given below-
Distribution of malnutrition in children in percentage in various
How many were normal in the number of the surveying in all the years?A4439B7723C2681D4192The following questions depends on the table given below-
Distribution of malnutrition in children in percentage in various
What was the approximate percentage decrease in moderate cases from 1998 to 2004?A57B37C43D1123The following questions depends on the table given below-
Distribution of malnutrition in children in percentage in various
How many percent approximately was mild malnutrition in all the years together?A30B32C42D46
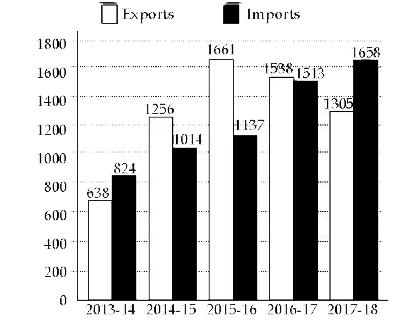
In which financial year the percentage increase in imports is the highest in comparison to its previous financial year?
View SolutionIn which year the percentage increase of students in school A is the highest in comparison to its previous years?
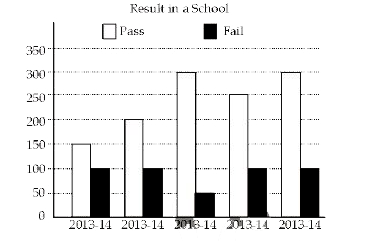
View SolutionThe given bar graph presents the results in terms of number of students in a school for the five academic year 2013-2014 to 2017-2018.

In which year the percentage increase in the total number of students is the highest in a comparison to the previous academic year?
View SolutionIn which year, the percentage increase in students in school B is the highest in comparison to its previous year
View SolutionThe given bar graph presents the Imports and Exports of an item manufactured by a company for the five financial years, 2013-2014 to 2017-2018.

In which financial year the percentage increase in imports and Exports taken together is the lowest in comparison to its previous financial year?
View Solution
