Curve X on the graph shows the effect of light intensity on the rate of photosynthesis.
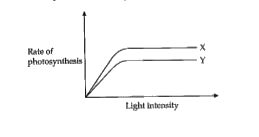
How have the conditions changed to produce curve Y?
Decreased concentration of carbon dioxide.
Decreased light intensity.
Increased concentration of carbon dioxide.
Increased light intensity.
The correct Answer is:A
At low light intensities, increasing the intensity of light will initially increase the rate of photosynthesis. At a certain point, increasing the light intensity stops increasing the rate as something else is limiting the rate. The factors which could be limiting the rate when the line on the graph is horizontal include temperature not being high enough or not enough carbon dioxide.
Topper's Solved these Questions
- PHOTOSYNTHESISBOOK - ICSECHAPTER - PHOTOSYNTHESISEXERCISE - ASSERTION & REASON
6 Videos
- PHOTOSYNTHESISBOOK - ICSECHAPTER - PHOTOSYNTHESISEXERCISE - STATE THE FUNCTION OF THE FOLLOWING:
2 Videos
- NERVOUS SYSTEM BOOK - ICSECHAPTER - NERVOUS SYSTEM EXERCISE - REVIEW QUESTIONS (Find the odd one out: )
10 Videos
- POLLUTION BOOK - ICSECHAPTER - POLLUTION EXERCISE - REVIEW OLUESTIONS
55 Videos
Similar Questions
Knowledge Check
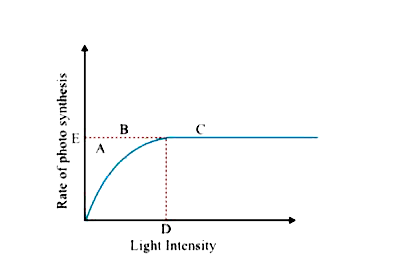
Study the given graph showing the efect of light intensity on the rate of photosynthesis. Which of the following statemetns regarding this is correct?
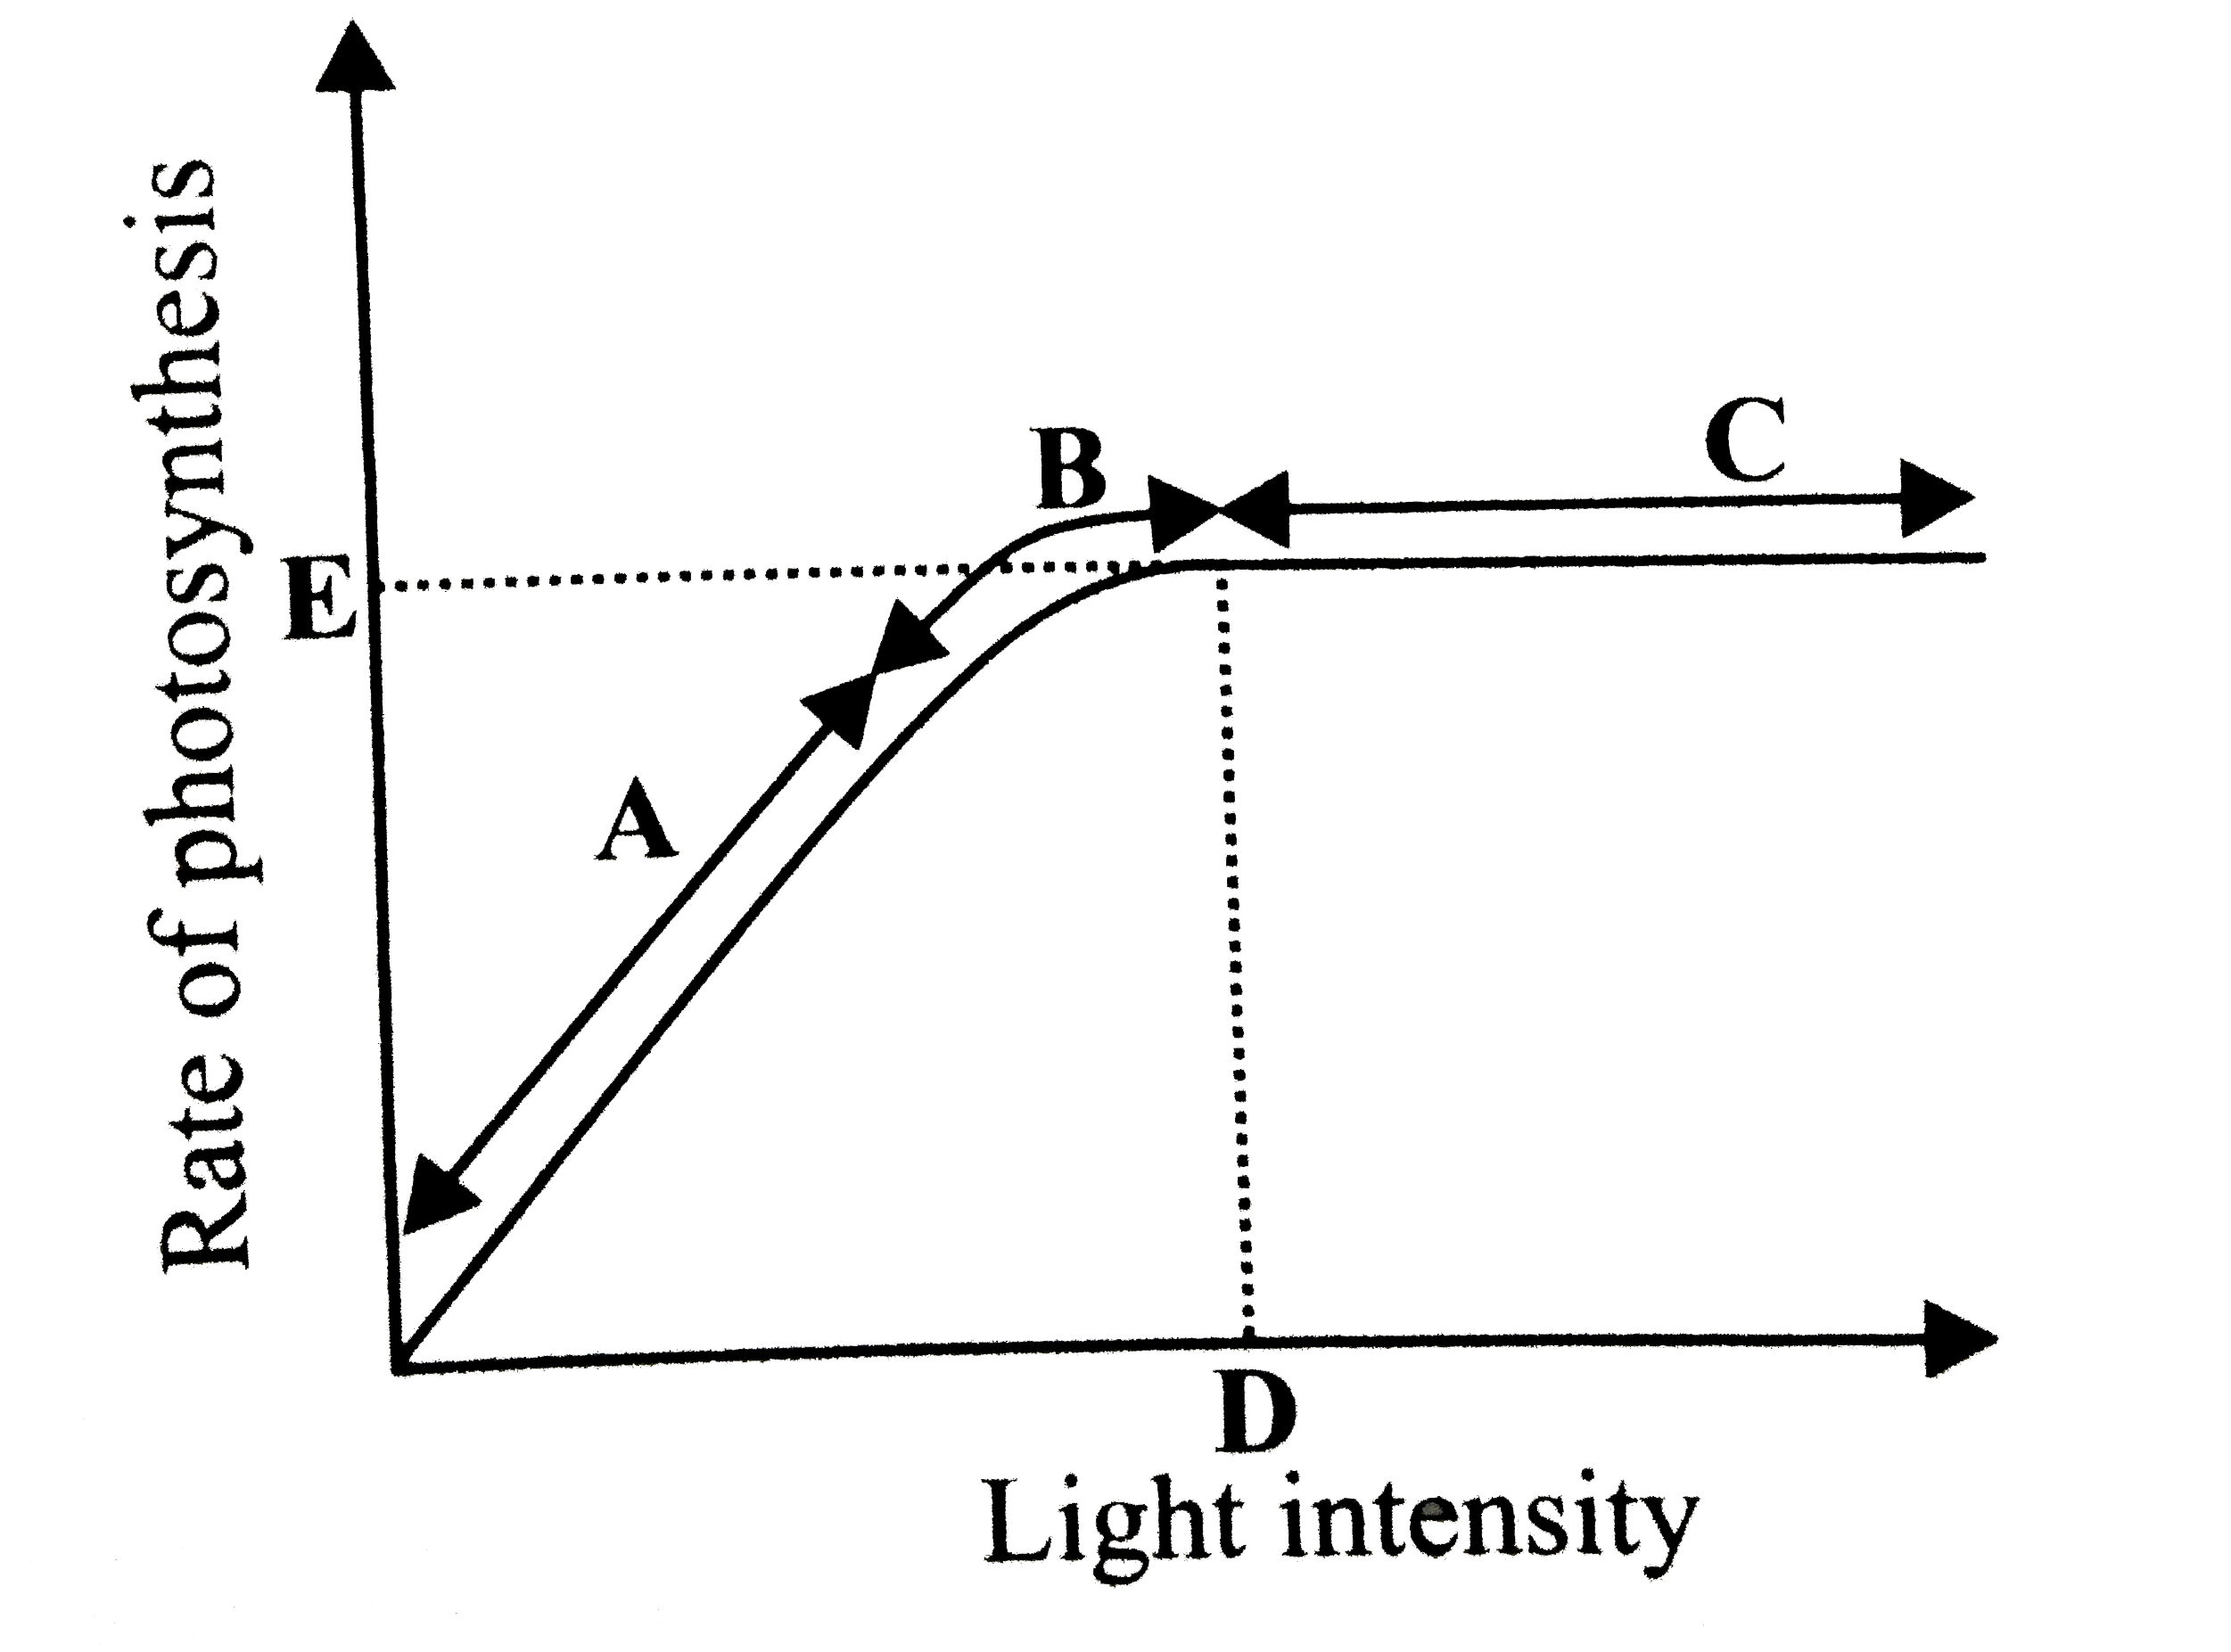 ALight is a limiting factor in the region a.BRegion C represents that rate of photosynthesis is because some other factor became limiting.Cpoint D rrepresents the intensity of light at which some other factor became limitingDAll of these
Study the given graph showing the efect of light intensity on the rate of photosynthesis. Which of the following statemetns regarding this is correct?
 ALight is a limiting factor in the region a.BRegion C represents that rate of photosynthesis is because some other factor became limiting.Cpoint D rrepresents the intensity of light at which some other factor became limitingDAll of these
At higher light intensities the rate of photosynthesis decreases because of -
Aother factors becoming limitingBdestruction/photoxidation of chlorophyllCBoth (1) and (2)Dcarotenoids are killed
The figure shows the effect of light on the rate of photosynthesis. Based on the graph, answer the following questions :
What do region C and D represent on the curve ?
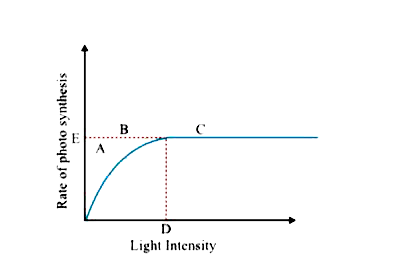
View SolutionFigure shows the effect of light on the rate of photosynthesis.
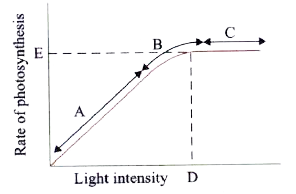
Based on the graph, answer the following questions.
What do C and D represent on the curve?
View SolutionThe figure shows the effect of light on the rate of photosynthesis. Based on the graph, answer the following questions :
What could be the limiting factor(s) in region A ?
View SolutionFigure shows the effect of light on the rate of photosynthesis.
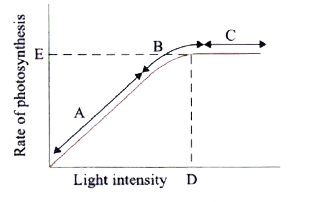
Based on the graph, answer the following questions.
What would be the limiting factors in region A?
View SolutionAt higher light intensities the rate of photosynthesis decreases because of -
View Solution
