If output of machine A is 20% damaged and out of the rest another 37.5% falls in lower quality grade. Which of the following figure will depict the output of the good quality.




To solve the problem, we need to determine the percentage of good quality output from machine A based on the given information.
Step 1: Determine the total output of the machine.
Let's assume the total output of machine A is 100% (or 1,000 items for simplicity).
Step 2: Calculate the damaged items.
According to the problem, 20% of the output is damaged.
- Damaged items = 20% of 1,000 = 200 items.
Step 3: Calculate the remaining items after removing damaged items.
- Remaining items = Total items - Damaged items
- Remaining items = 1,000 - 200 = 800 items.
Step 4: Calculate the lower quality items.
Out of the remaining items, 37.5% are of lower quality.
- Lower quality items = 37.5% of 800 = 0.375 * 800 = 300 items.
Step 5: Calculate the good quality items.
To find the good quality items, we subtract the lower quality items from the remaining items.
- Good quality items = Remaining items - Lower quality items
- Good quality items = 800 - 300 = 500 items.
Step 6: Calculate the percentage of good quality items.
Now, we can calculate the percentage of good quality items out of the total output.
- Percentage of good quality = (Good quality items / Total items) * 100
- Percentage of good quality = (500 / 1,000) * 100 = 50%.
Conclusion:
The output of good quality items from machine A is 50%.
Let's assume the total output of machine A is 100% (or 1,000 items for simplicity).
According to the problem, 20% of the output is damaged.
- Damaged items = 20% of 1,000 = 200 items.
- Remaining items = Total items - Damaged items
- Remaining items = 1,000 - 200 = 800 items.
Out of the remaining items, 37.5% are of lower quality.
- Lower quality items = 37.5% of 800 = 0.375 * 800 = 300 items.
To find the good quality items, we subtract the lower quality items from the remaining items.
- Good quality items = Remaining items - Lower quality items
- Good quality items = 800 - 300 = 500 items.
Now, we can calculate the percentage of good quality items out of the total output.
- Percentage of good quality = (Good quality items / Total items) * 100
- Percentage of good quality = (500 / 1,000) * 100 = 50%.
The output of good quality items from machine A is 50%.
Similar Questions
Coffee beans of two different qualities are mixed and sold at 20 % profit. If the higher quality beans are sold at the above price, then the loss is 4 %. If the ratio of lower quality and the higher quality beans in the mixture is 5 : 2, then the percentage profit when the lower quality beans are sold at the same price is :
View SolutionA food chain depicts the flow of energy from one trophic level to another. Which of the following represents the percentage of energy transfer from one trophic level to the next?
View Solution
Knowledge Check
If the expenditure on advertisement of a company is 20% decreased and out of the rest another 37.5% decreases, then which of the following figure best depicts I represents the situation ?
A B
B C
C D
D
The figure below shows a circuit and its input voltage vi as function of time t.
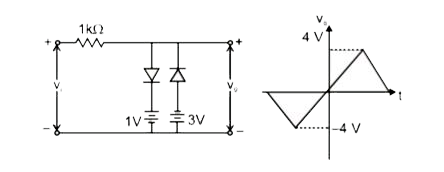
Assuming the diodes to be ideal, which of the following graphs depicts the output voltage v0 as function of time t ?A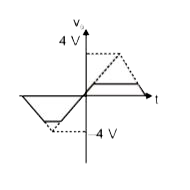 B
B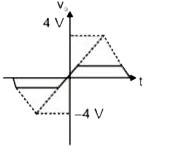 C
C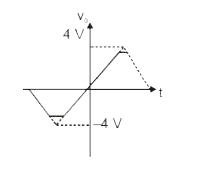 D
D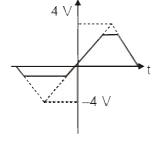
If 26% people in Chapra district are 'Rajputs' and 13% are 'Yadavs', then which of the following figures best depicts/represents the situation ?
A B
B C
C D
D
The length of a rectangle is reduced by 20% and breadth is kept constant, and the new figure that is formed is a square. Consider the following statements: The area of square is 25% less than the area of rectangle. The perimeter of square is approximately 11% less than the perimeter of rectangle. The diagonal of square is approximately 12% less than the diagonal of rectangle. Which of the statements given above is/are correct? (a) 1 only (b) 1 and 2 (c) 2 and 3 (d) 1, 2 and 3
View SolutionBefore the arrival of Joe, a new partner, sales output in Bill's company. Midas in Reverse Ltd, had been rising by 10% per year on average. Innovations by Joe included computerisation of technical processes and reductions in the work force, but annual sales output has only risen by 5% per year. It appears that Joe's innovations have caused the reduction in the annual growth rate.
Which of the following, if true, would most seriously weaken the conclusion above ?
View Solution10% of wheat sold by a Grocer is of lower quality. How much wheat of good quality should be mixed with 150 kg of wheat of lower quality quantity be 5%?
View SolutionSome amount out of Rs. 6000 was lent out at 10% per annum and the rest amount at the rate 20% per annum and thus in 4 years the total interest from both the amounts collected was Rs. 3400. What is the amount which was lent out at the rate of 10% per annum?
View SolutionPankaj and Sushil invested some amount of money in the ratio of 3: 5for the same period in a business. They decided that at the end of year 20%profit was to be given to AIDS Control Society of India as a donation. Out of the remaining, 75% was to be reinvested and the rest of die profit was to be divided as interest on their capitals. If the difference in their shares is ₹ 1200. Find the total profit?
View Solution
