What is the total value of revenue of the firm (in crores Rs) in years 2010, 2011 and 2012?
910
930
950
1020
The correct Answer is:B
To find the total revenue of the firm for the years 2010, 2011, and 2012, we can follow these steps:
1. Identify the Revenue for Each Year:
- For the year 2010, the revenue is 260 crores.
- For the year 2011, the revenue is 350 crores.
- For the year 2012, the revenue is 320 crores.
2. Add the Revenues Together:
- To find the total revenue for the years 2010, 2011, and 2012, we need to sum the revenues:
Total Revenue=Revenue in 2010+Revenue in 2011+Revenue in 2012
- Substituting the values:
Total Revenue=260+350+320
3. Calculate the Total:
- First, add 260 and 350:
260+350=610
- Now, add 320 to the result:
610+320=930
4. Conclusion:
- The total revenue of the firm in the years 2010, 2011, and 2012 is 930 crores.
Final Answer:
The total value of revenue of the firm in years 2010, 2011, and 2012 is 930 crores Rs.
- For the year 2010, the revenue is 260 crores.
- For the year 2011, the revenue is 350 crores.
- For the year 2012, the revenue is 320 crores.
- To find the total revenue for the years 2010, 2011, and 2012, we need to sum the revenues:
Total Revenue=Revenue in 2010+Revenue in 2011+Revenue in 2012
- Substituting the values:
Total Revenue=260+350+320
- First, add 260 and 350:
260+350=610
- Now, add 320 to the result:
610+320=930
- The total revenue of the firm in the years 2010, 2011, and 2012 is 930 crores.
The total value of revenue of the firm in years 2010, 2011, and 2012 is 930 crores Rs.
Similar Questions
Following is a data regarding export and import of a company over the years. Answer the question given below.
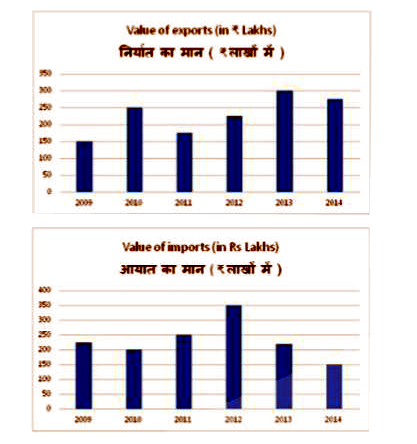
The value of imports in year 2011 was what percentage (approximate) of the average value of exports in the years 2009, 2010 and 2011?View SolutionThe given Bar Graph presents the Revenue and Expenditure (in crores of Rupees ) of a company during the five year period, 2014-2018.
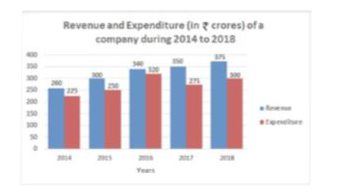
What is the ratio of the total revenue of the company in 2015 and 2018 to that of its expenditure in 2014 and 2018 ?View Solution
Knowledge Check
- Question 1 - Select One
The bar graph given below represents the revenue of a firm for 8 years. All the revenue figures have been shown in terms of Rs. crores.
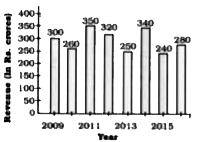
What is the total value of revenue of the firm (in Rs. crores) in years 2010, 2011 and 2012?A910B930C950D1020 - Question 2 - Select One
The bar chart given below shows the revenue (in crores) of company A for the years 2008 to 2015.
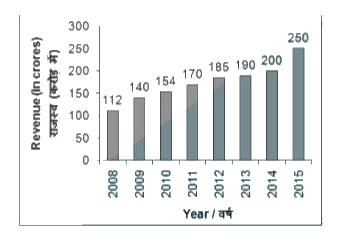
What is the average revenue (in crore Rs) per year from 2011 to 2015?Aa)199Bb)203Cc)192Dd)189 - Question 3 - Select One
The bar chart given below shows the revenue (in Rs. crores) of company A for the years 2008 to 2015.
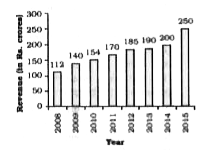
What is the average revenue (in Rs. crores) per year from 2011 to 2015?A199B203C192D189
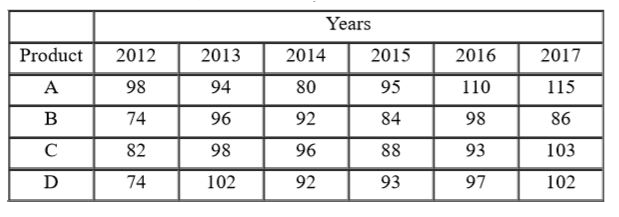
The given table represents the revenue (in Rs. Crores) of a company from the sale of four products A, B, C and D in 6 year . Study the table carefully and answer the question that following.
By what percentage is the total revenue of the company from the sale of products A, B and D in 2012 and 2013 more tha the total revenue from the sale of product B in 2013 to 2016?
 View Solution
The table given below shows the revenue (in crores) of a company from years 2010 to 2016)
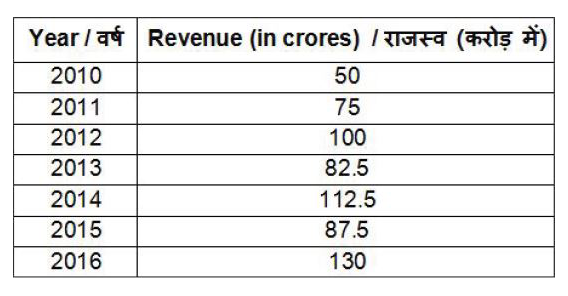
What is the average revenue (in crores) from year 2010 to 2014?View SolutionThe table given below shows the revenue (in crores) of a company from years 2010 to 2016)
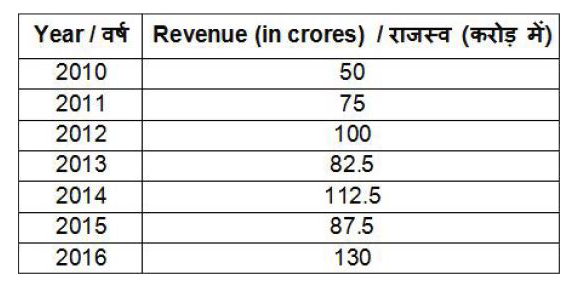
In how many years, the revenue was more than that in year 2013?View SolutionThe line chart given below shows the revenue of a company (in lac rupees) from year 2009 to 2016
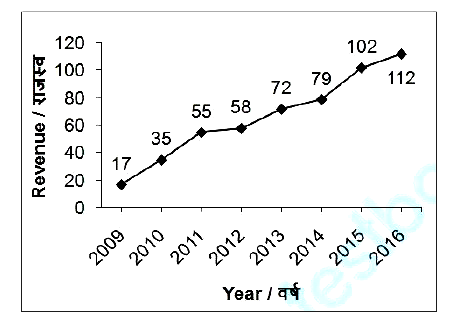
In how many years from 2010 to 2016 the increase in the revenue is more than 20% of the previous year value?View SolutionThe line chart given below shows the revenue of a company (in lac rupees) from year 2009 to 2016.
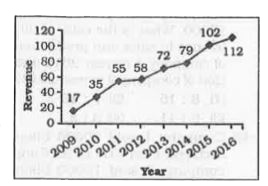
In how many years from 2010 to 2016 the increase in the revenue is more than 20% of the previous year value?View Solution

