Read the table and answer the questions
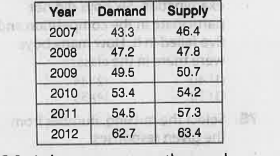
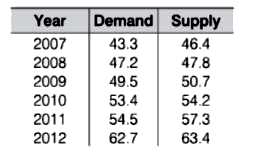
The following table gives demand and supply of sugar in million tons, for the period 2007, to 2012 . Surplus is defined as excess of supply over demand
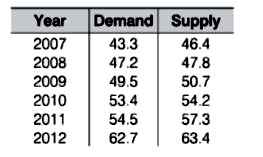
The average surplus (in million tons) of sugar for the period 2008 to 2012 is
1.44
1.84
1.53
1.22
The correct Answer is:D
Step by step video & image solution for Read the table and answer the questions The following table gives demand and supply of sugar in million tons, for the period 2007, to 2012 . Surplus is defined as excess of supply over demand The average surplus (in million tons) of sugar for the period 2008 to 2012 is by Maths experts to help you in doubts & scoring excellent marks in Class 14 exams.
Similar Questions
Direction :- Read the table and answer the questions.The following table gives demand and supply of sugar in million tonnes, for the period 2007 to 2012.Surplus is defined as excess of supply over demand.
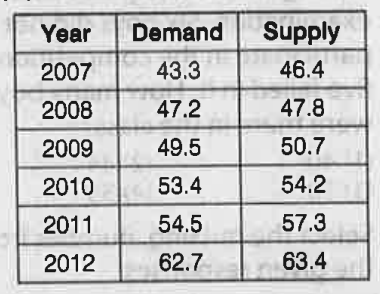
The average surplus (in million tonnes) of sugar for the period 2008 to 2012 isView SolutionRead the table and answer the questions
The following table gives demand and supply of sugar in million tons, for the period 2007, to 2012 . Surplus is defined as excess of supply over demand
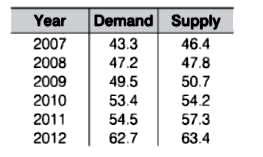
The surplus of sugar was lowest for the yearView Solution
Knowledge Check
- Question 1 - Select One
In how many years, the supply (in million tons) of sugar was more than the average supply from 2007 to 2012?
A5B4C3DA
Read the table and answer the questions
The following table gives demand and supply of sugar in million tons, for the period 2007, to 2012 . Surplus is defined as excess of supply over demand
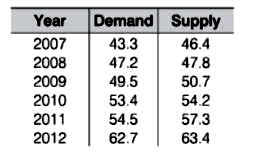
In how many years, the supply (in million tons) of sugar was more than the average supply for 2007 to 2012 ?View SolutionDirection :- Read the table and answer the questions.The following table gives demand and supply of sugar in million tonnes, for the period 2007 to 2012.Surplus is defined as excess of supply over demand.
 In how many years, the supply (in million tonnes) of sugar was more than average supply for 2007 to 2012?View Solution
Read the table and answer the questions
The following table gives demand and supply of sugar in million tons, for the period 2007, to 2012 . Surplus is defined as excess of supply over demand
The percentage increase in demand of sugar was the lowest as compared to its previous year inView SolutionThe following table shows the productions of food-grains (in million tons) in a state for the period 1999-2000 to 2003-2004. Read the table and answer the questions
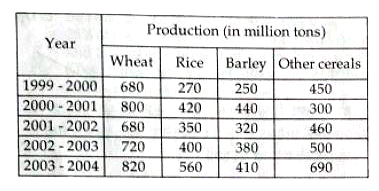
The difference of average production of rice and the average production of barley over the years isView SolutionDirection :- The following table shows the production of food grains (in million tonnes) in a state for the period 1988 to 1992. Read the table and answer the following questions.
 View Solution
Read the bar graph given below and answer the following questions.
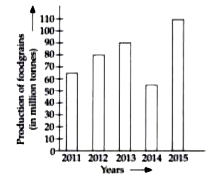
Find the difference between the production of foodgrains in million tonnes) in the year 2012 and 2015.View SolutionThe following table gives the production of steel (in millions of tons) for years 1976 to 1986.

Fit a trend line by the method of least squares. Also, obtain the trend value for the year 1990.View Solution

