Read the table and answer the questions
The following table gives demand and supply of sugar in million tons, for the period 2007, to 2012 . Surplus is defined as excess of supply over demand
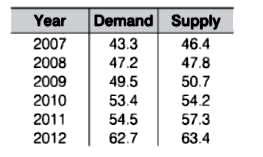
The surplus of sugar was lowest for the year
2012
2008
2009
2010
The correct Answer is:B
Step by step video & image solution for Read the table and answer the questions The following table gives demand and supply of sugar in million tons, for the period 2007, to 2012 . Surplus is defined as excess of supply over demand The surplus of sugar was lowest for the year by Maths experts to help you in doubts & scoring excellent marks in Class 14 exams.
Updated on:21/07/2023Similar Questions
Read the table and answer the questions
The following table gives demand and supply of sugar in million tons, for the period 2007, to 2012 . Surplus is defined as excess of supply over demand
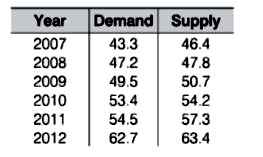
The average surplus (in million tons) of sugar for the period 2008 to 2012 is
View SolutionRead the table and answer the questions
The following table gives demand and supply of sugar in million tons, for the period 2007, to 2012 . Surplus is defined as excess of supply over demand
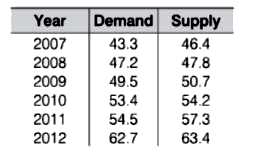
The percentage increase in demand of sugar was the lowest as compared to its previous year in
View Solution
Knowledge Check
The average surplus (in million tons) of sugar for the period 2008 to 2012 is
A1.44B1.84C1.53D1.22Study the table carefully to answer the questions that follow-
Which company has sold the maximum number of units over the years?AQBMCNDNone of theseStudy the following table carefully and answer the following question The following tables gives the information of sales of sports kits by the company "XYZ" over past five years (numbers in lakhs):

For hockey what is the total sales for past 5 years ?A214B160C183D221
Direction :- Read the table and answer the questions.The following table gives demand and supply of sugar in million tonnes, for the period 2007 to 2012.Surplus is defined as excess of supply over demand.
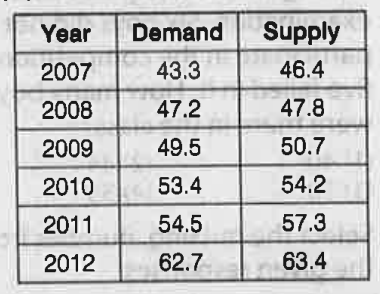
The average surplus (in million tonnes) of sugar for the period 2008 to 2012 is
View SolutionRead the table and answer the questions
The following table gives demand and supply of sugar in million tons, for the period 2007, to 2012 . Surplus is defined as excess of supply over demand
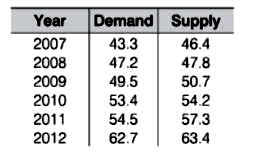
In how many years, the supply (in million tons) of sugar was more than the average supply for 2007 to 2012 ?
View SolutionDirection :- Read the table and answer the questions.The following table gives demand and supply of sugar in million tonnes, for the period 2007 to 2012.Surplus is defined as excess of supply over demand.
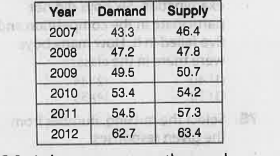 In how many years, the supply (in million tonnes) of sugar was more than average supply for 2007 to 2012?
View SolutionFollowing table shows the amount of sugar production (in lac tons) for the years 1971 to 1982.

Fit a trend line by the method of least squares.
View SolutionDirection :- The following table shows the production of food grains (in million tonnes) in a state for the period 1988 to 1992. Read the table and answer the following questions.

View Solution
