Line graph given below shows total number of books (in hundred) printed by two different publishers A and B together and shows percentage of books printed by publisher B out of total books printed. Read data carefully and answer the following questions:
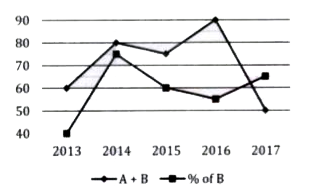
Books printed by A in year 2018 is half of the total books printed by both in year 2014 and ratio of books printed by publisher A to B in year 2018 is 5:3. Then books printed by publisher B in the year 2018 is how much less than books printed by A in year 2015?
800
400
600
200
The correct Answer is:C
Step by step video, text & image solution for Line graph given below shows total number of books (in hundred) printed by two different publishers A and B together and shows percentage of books printed by publisher B out of total books printed. Read data carefully and answer the following questions: Books printed by A in year 2018 is half of the total books printed by both in year 2014 and ratio of books printed by publisher A to B in year 2018 is 5:3. Then books printed by publisher B in the year 2018 is how much less than books printed by A in year 2015? by Maths experts to help you in doubts & scoring excellent marks in Class 14 exams.
Updated on:21/07/2023Topper's Solved these Questions
- DATA INTERPRETATIONBOOK - ADDA247CHAPTER - DATA INTERPRETATIONEXERCISE - Mains Questions
33 Videos
- DATA INTERPRETATIONBOOK - ADDA247CHAPTER - DATA INTERPRETATIONEXERCISE - Previous Year Questions
56 Videos
- DATA INTERPRETATIONBOOK - ADDA247CHAPTER - DATA INTERPRETATIONEXERCISE - Prelims Questions (Level-1)
54 Videos
- BOAT AND STREAM BOOK - ADDA247CHAPTER - BOAT AND STREAM EXERCISE - Previous Year Question
22 Videos
- DATA SUFFICIENCY BOOK - ADDA247CHAPTER - DATA SUFFICIENCY EXERCISE - PREVIOUS YEAR QUESTIONS
25 Videos
Similar Questions
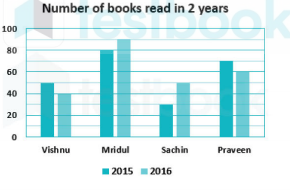
Directions: Read the bar graph carefully and answer the given questions.What is the average of total number of books read by all of them in the year 2016?
View Solution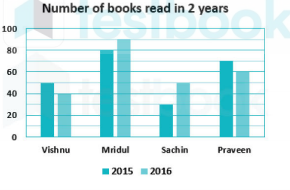
Directions: Read the bar graph carefully and answer the given questions.Books read by Praveen in the year 2015 is what percent more or less than the number of books read by Mridul in the year 2015 ?
View Solution
Knowledge Check
The following pie-chart shows the percentage distribution of the expenditure incurred in publishing a book. Read the pie-chart and answer the questions.
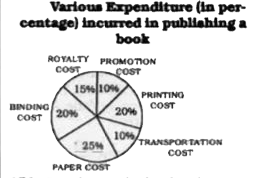
Royality on the book is less than the printing cost by :A20%B5%C25%D3313Direction: The following pie chart shows the percentage of production of books by different companies in a year. Read the chart and answers the following questions.
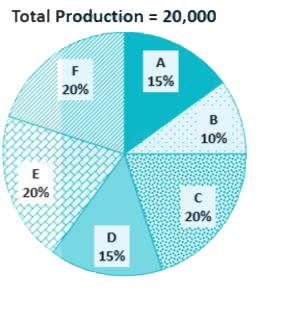
Find the average production of books by company B and C:A6000B3000C4000D5000The Bar graph given below presents the number of books sold by a bookseller during different months of a year.
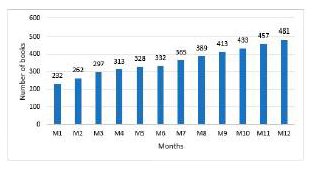
What is the total number of books sold by the bookseller in the year?A4032B4132C4302D4202
Read the bar graph which shows the number of books sold by a bookstore during five consecutive years and answer the following questions
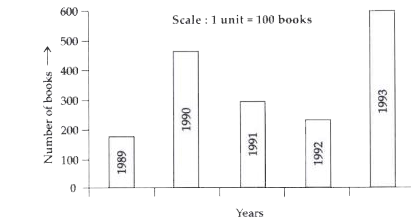
In which year highest books were sold ?
View SolutionThe following graph shows the number of books read by Ashok in a week.
Find the ratio of number of books read on Tuesday and Wednesday together to the total number of books, read.
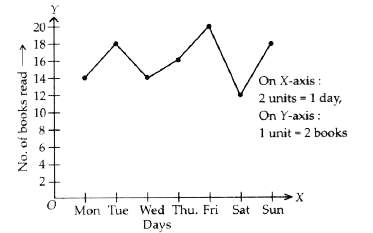
View Solution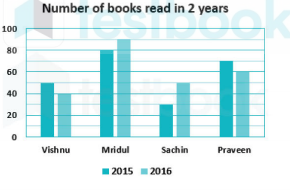
Directions: Read the bar graph carefully and answer the given questions.Total number of books read by Sachin and Mridul in both the years is how much more or less than the total number of books read by Praveen and Vishnu in both the years?
View Solution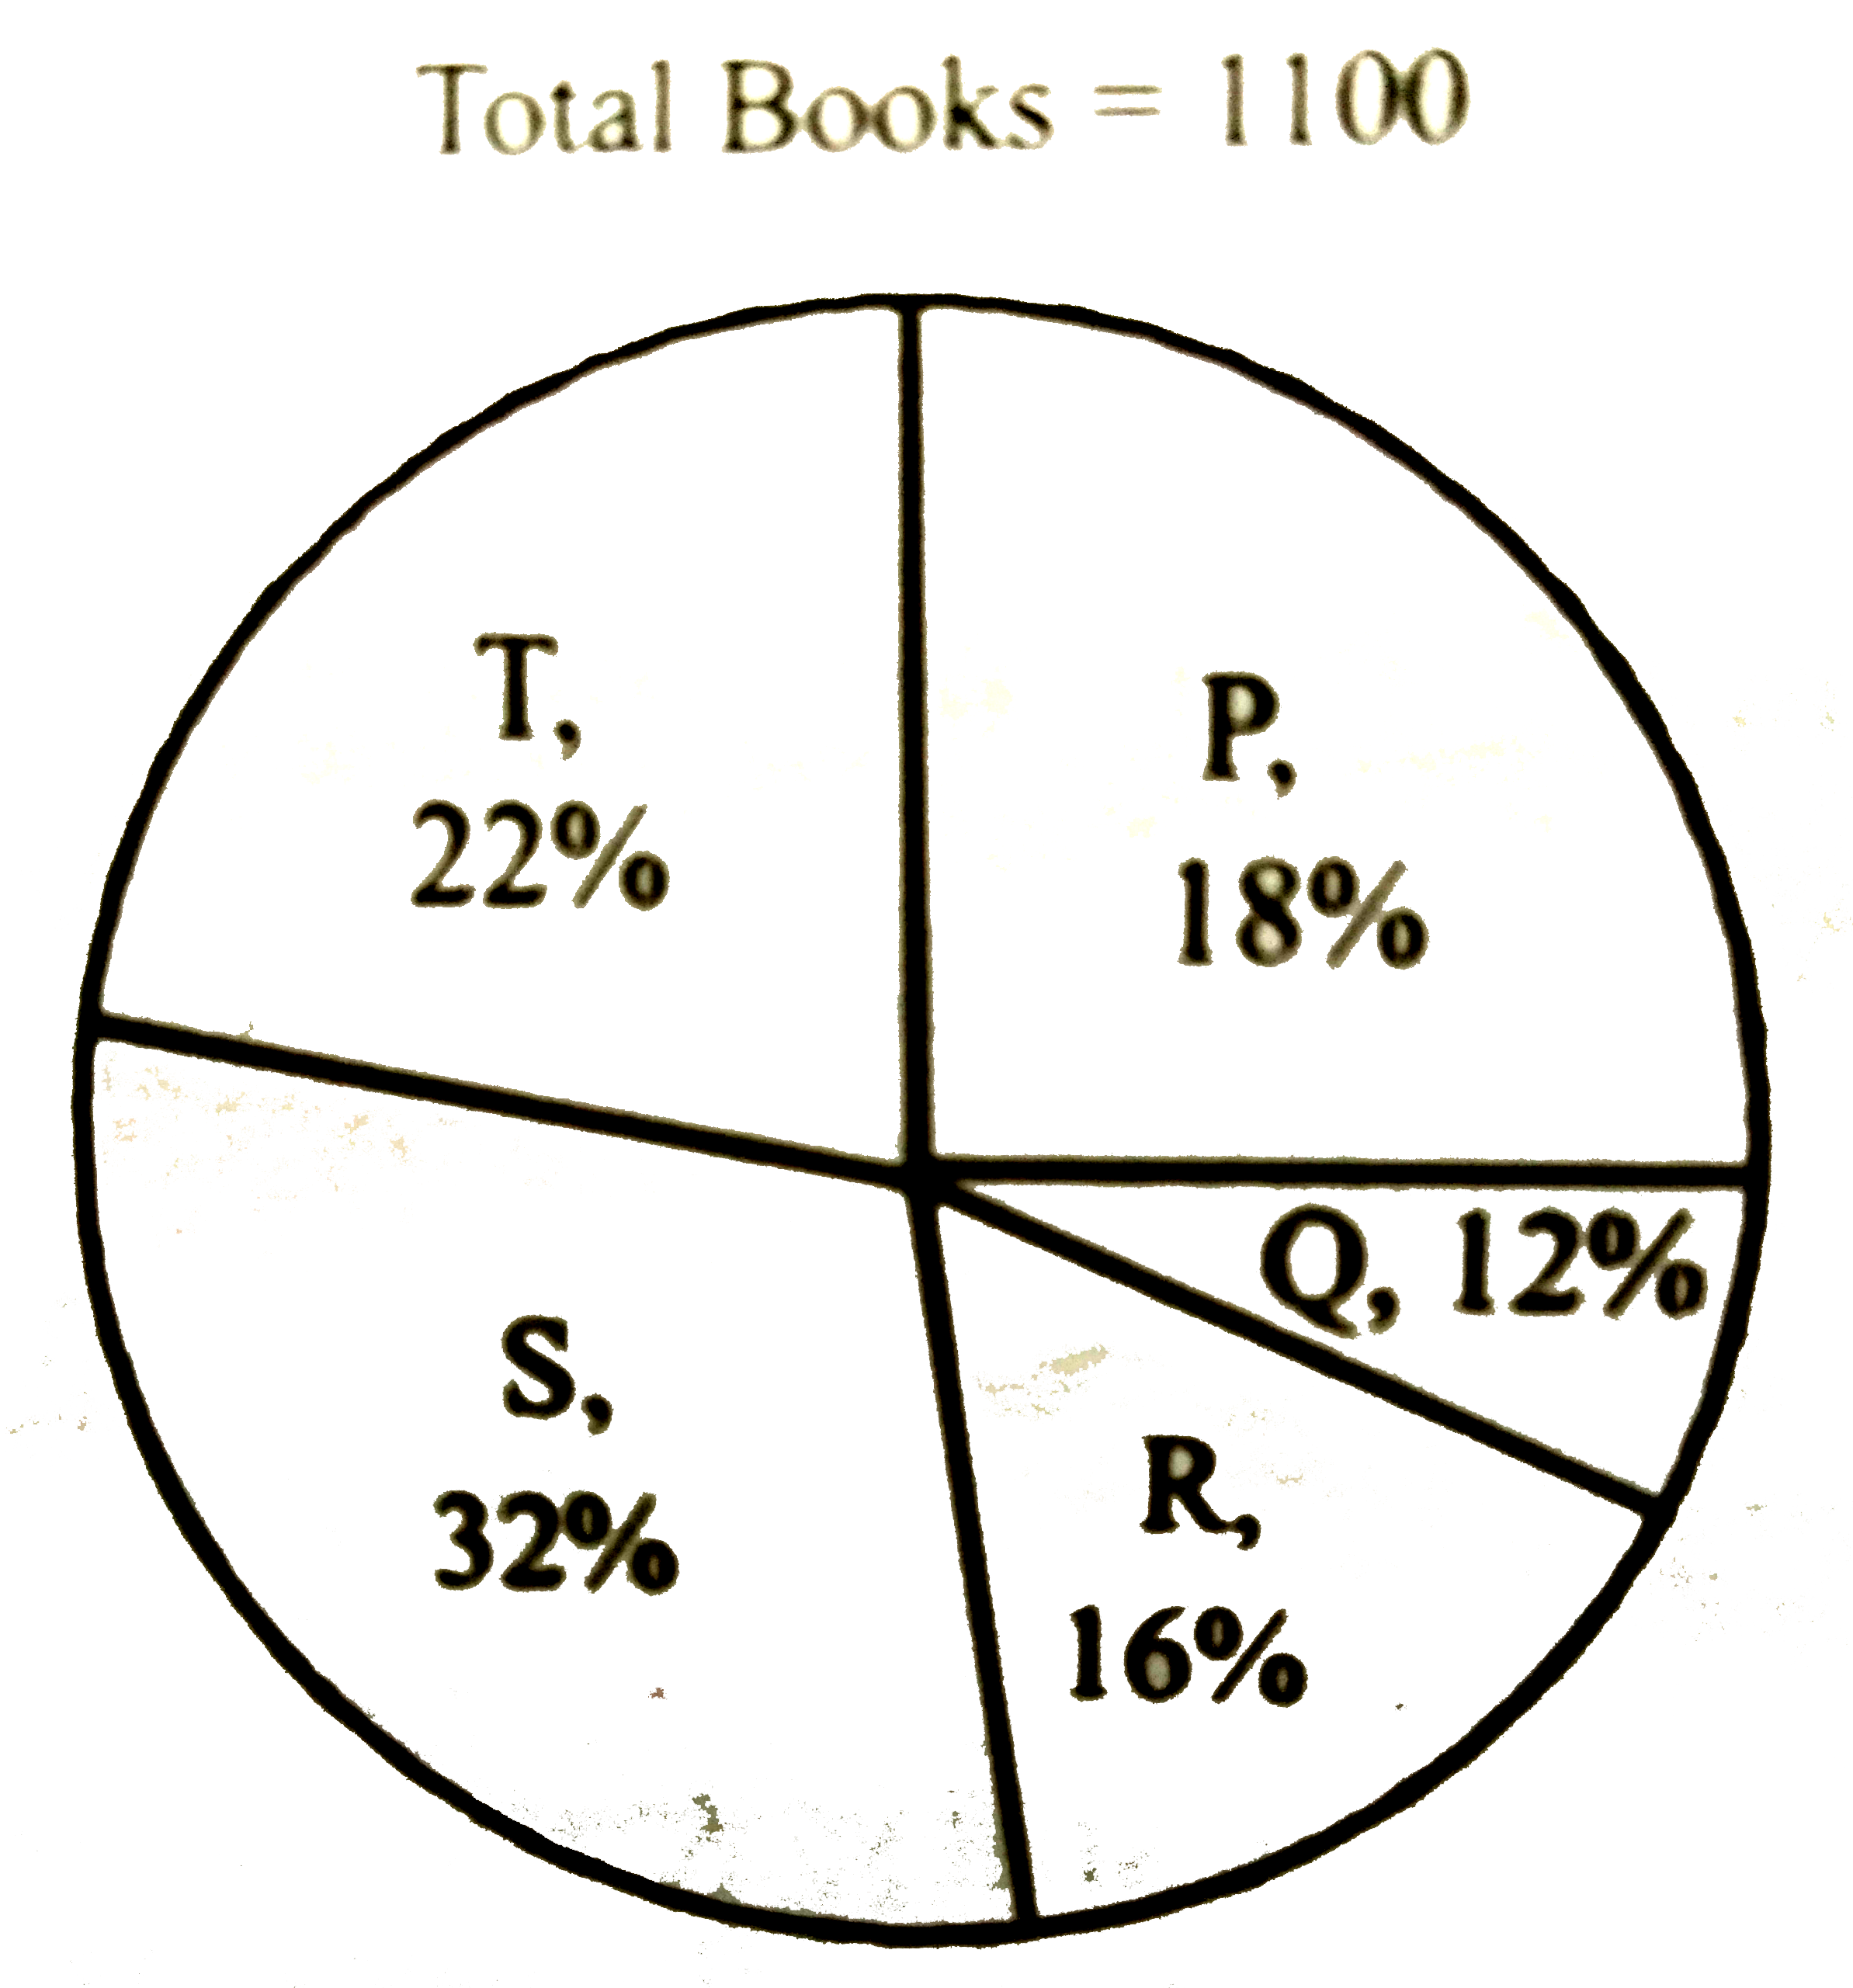
What is the ratio of total books sold by store P and R together to the total books sold by store S and T together
View SolutionDirection: Study the data carefully and answer the following questions.
Following is the data given of selling of 5 shops A, B, C, D and E of two different types of books.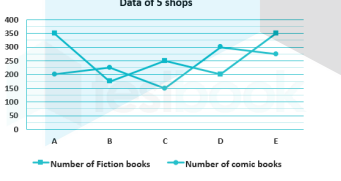
Find the difference between total comic books sold to total fiction books sold from all the shops.
View Solution
