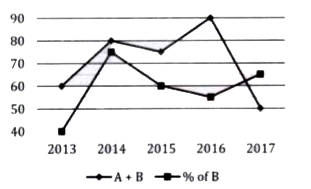
Line graph given below shows total number of books (in hundred) printed by two different publishers A and B together and shows percentage of books printed by publisher B out of total books printed. Read data carefully and answer the following questions:
11,36,000
11,42,000
11,48,000
11,34,000
The correct Answer is:D
Topper's Solved these Questions
- DATA INTERPRETATIONBOOK - ADDA247CHAPTER - DATA INTERPRETATIONEXERCISE - Mains Questions
33 Videos
- DATA INTERPRETATIONBOOK - ADDA247CHAPTER - DATA INTERPRETATIONEXERCISE - Previous Year Questions
56 Videos
- DATA INTERPRETATIONBOOK - ADDA247CHAPTER - DATA INTERPRETATIONEXERCISE - Prelims Questions (Level-1)
54 Videos
- BOAT AND STREAM BOOK - ADDA247CHAPTER - BOAT AND STREAM EXERCISE - Previous Year Question
22 Videos
- DATA SUFFICIENCY BOOK - ADDA247CHAPTER - DATA SUFFICIENCY EXERCISE - PREVIOUS YEAR QUESTIONS
25 Videos
Similar Questions
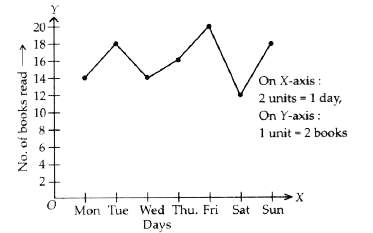
The following graph shows the number of books read by Ashok in a week.
Find the ratio of number of books read on Tuesday and Wednesday together to the total number of books, read.
View SolutionDirection: The bar graph shown below indicate the number of books owned and the number of books issued by the 5 different libraries A, B, C, D, and E. Based on the given bar graph answer the question given below:
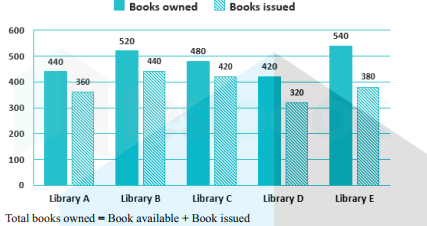
What is the ratio of total books owned by all the libraries together to total books issue by all the libraries together?
View Solution
Knowledge Check
The Bar graph given below presents the number of books sold by a bookseller during different months of a year.
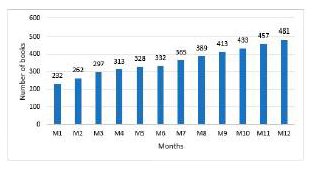
What is the total number of books sold by the bookseller in the year?A4032B4132C4302D4202Circle graph given above shows the expenditure incurred in bringing out a book, by a publisher.
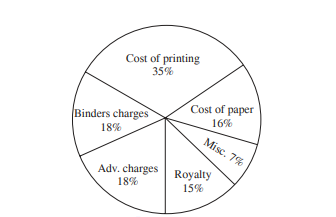
What should be the central angle of the sector for the cost of the paper ?A22.5∘B16∘C54.8∘D57.6∘Circle graph given above shows the expenditure incurred in bringing out a book, by a publisher.
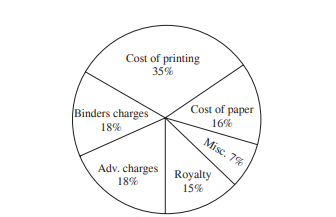
Royalty on the book is less than the advertisement charges by -----A3%B20%C1623%DNone of these
Direction: The bar graph shown below indicate the number of books owned and the number of books issued by the 5 different libraries A, B, C, D, and E. Based on the given bar graph answer the question given below:
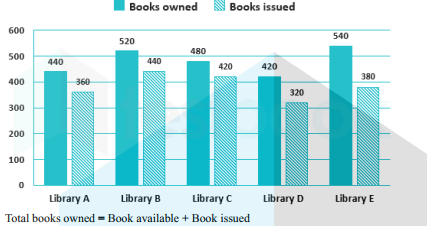
What is the ratio of total books owned by all the libraries together to total books issue by all the libraries together?
View SolutionGiven bar graph shows the number of books of difference subjects kept in a library. Study it and answer the following questions :
How many Hindi books are kept in the library ?
View SolutionThe following graph shows the number of books read by Ashok in a week.
On which day Ashok read the maximum number of books?
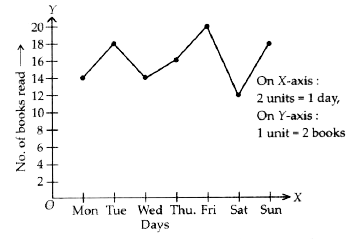
View SolutionThe following graph shows the number of books read by Ashok in a week.
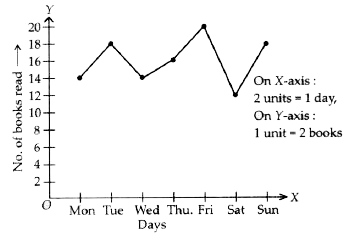
How many books Ashok read on Monday and Tuesday altogether?
View Solution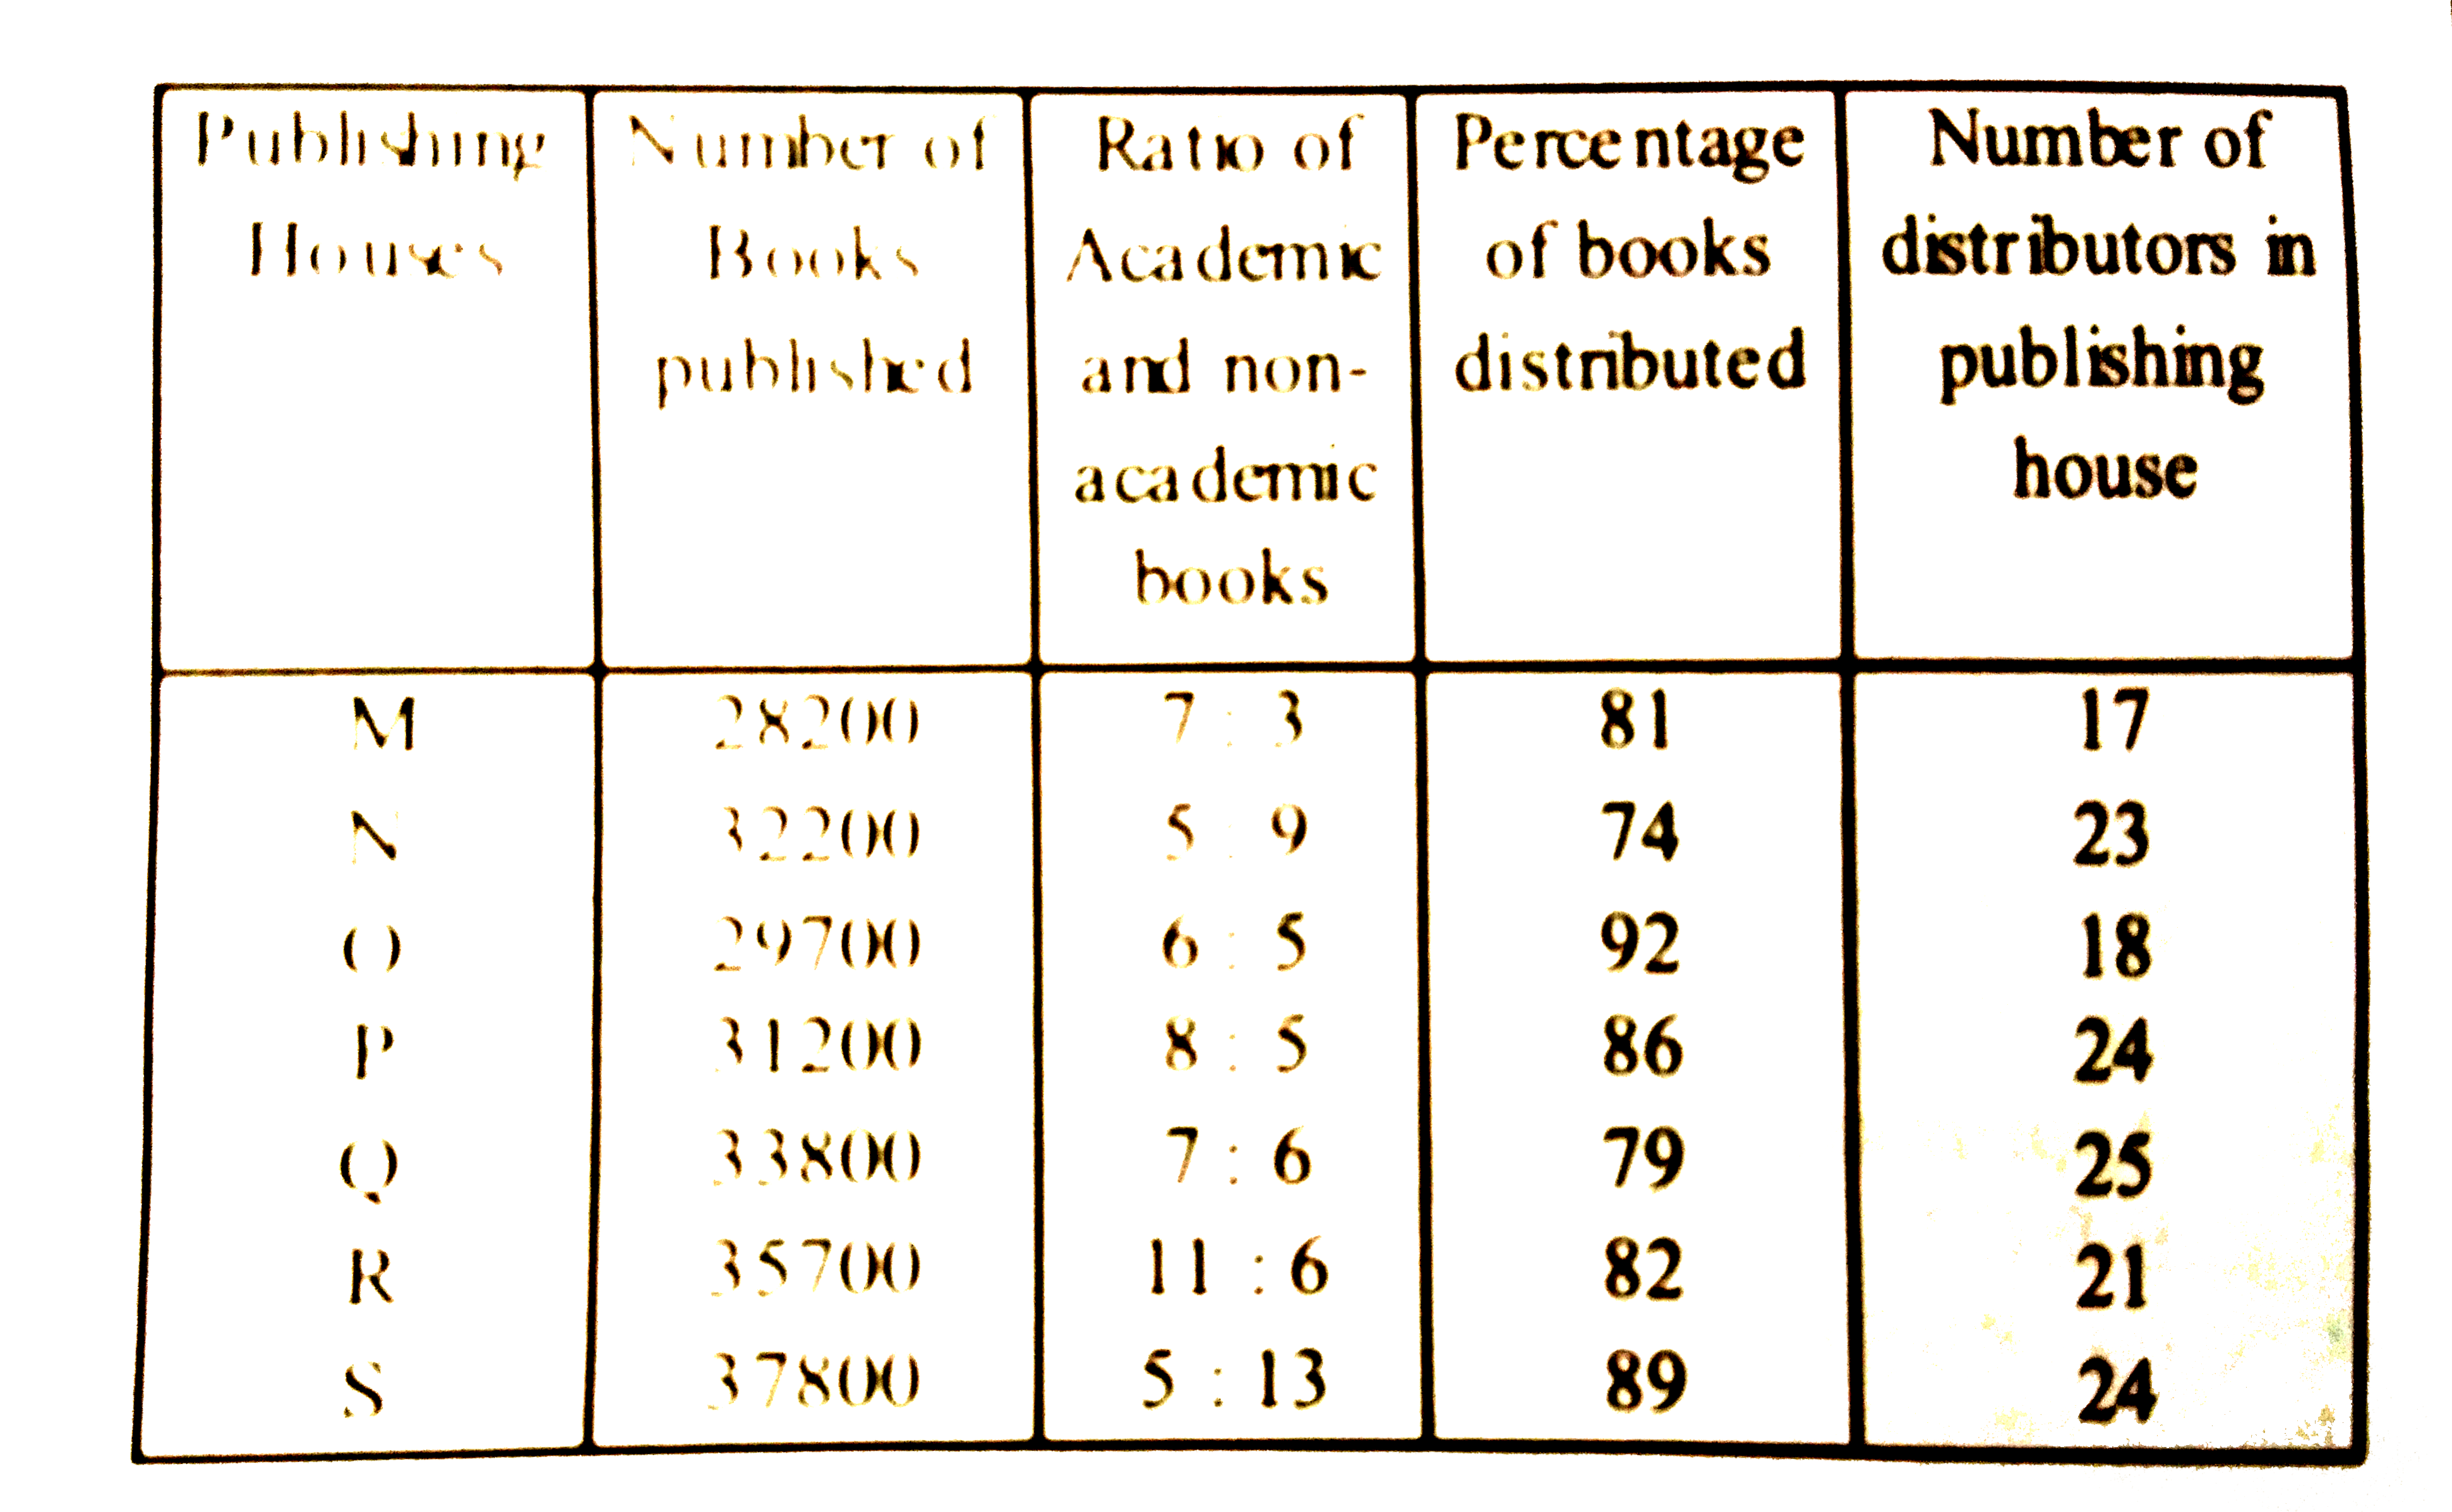
If the total number of boks published P,Q and R is increased by 30% and the total number of books pyblished by remaining publishers be decreases by 20% what will be the new average of books published by all the publishers ?
View Solution
