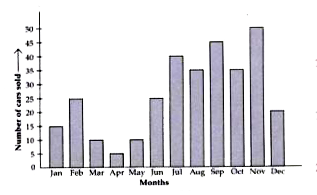
The given double bar graph shows the sale of mobile phone and cars from 2005 to 2008
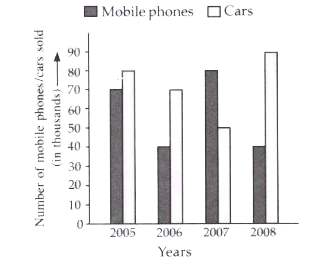
(i) Find the ratio of the tatal number of mobile phones sold in 2006 and 2008 to the total number of cars sold in 2005 and 2007
(ii) What is the average number of cars sold from 2005 to 2008
(i) 8 : 13
(ii) 72500
(i) 13 : 16
(ii) 72500
(i) 8 : 13
(ii) 97000
(i) 16 : 17
(ii) 89000
The correct Answer is:A
Step by step video, text & image solution for The given double bar graph shows the sale of mobile phone and cars from 2005 to 2008 (i) Find the ratio of the tatal number of mobile phones sold in 2006 and 2008 to the total number of cars sold in 2005 and 2007 (ii) What is the average number of cars sold from 2005 to 2008 by Maths experts to help you in doubts & scoring excellent marks in Class 7 exams.
Topper's Solved these Questions
- BOOK - SCIENCE OLYMPIAD FOUNDATION CHAPTER - IMO QUESTION PAPER 2018-19 SET AEXERCISE - Logical Reasoning20videos
IMO QUESTION PAPER 2018-19 SET A
- BOOK - SCIENCE OLYMPIAD FOUNDATION CHAPTER - IMO QUESTION PAPER 2018-19 SET AEXERCISE - Logical Reasoning20videos
IMO QUESTION PAPER 2018-19 SET A
- BOOK - SCIENCE OLYMPIAD FOUNDATION CHAPTER - IMO QUESTION PAPER 2018-19 SET - BEXERCISE - ACHIEVERS SECTION5videos
IMO QUESTION PAPER 2018-19 SET - B
- BOOK - SCIENCE OLYMPIAD FOUNDATION CHAPTER - IMO QUESTION PAPER 2019-20 SET AEXERCISE - ACHIEVERS SECTION5videos
IMO QUESTION PAPER 2019-20 SET A
Similar Questions
Knowledge Check
- Question 1 - Select One
If 5% of the total number of cars sold of model E is 750, then what is the average number of cars sold of all the models?
A15000B14400C16800D14000 - Question 2 - Select One
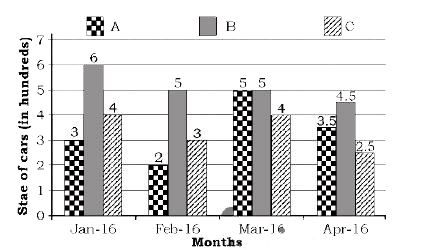
What was the average number of cars sold by A during Feb-Apr 2016
 A375B350C250D300
 - Question 3 - Select One
The given table represents the sale (in thousands) of cars by four companies A,B,C and D in six years. Study the table and answer the questions that follow:
दी गयी तालिका चार कंपनियों - A, B, C और D के द्वारा छः वर्षों में की गयी कारों की बिक्री ( हज़ार में ) दर्शाती है | इस तालिका का अध्ययन करें तथा फिर पूछे गए प्रश्नों के उत्तर दें |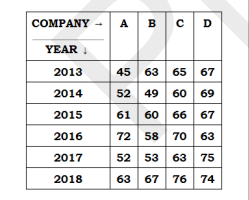 What is the ratio of total number of cars sold by companies A,B and D in 2017 to the total number
of cars sold by all companies in 2018?
कंपनी A, B और D के द्वारा 2017 में बेची गयी कारों की कुल संख्या तथा 2018 में सभी कंपनियों के द्वारा बेची गयी कारों की कुल संख्या के बीच क्या अनुपात है ?A3:4B6:13C9:14D18:23
If the number of cars sold of model D is 40500, what is the ratio between the number of cars sold of model D and E?
View SolutionThe table shows the number of cars sold by three showrooms over a period of six years.
यह तालिका तीन शोरूम द्वारा छः वर्षों की अवधि में बेची गयी कारों की संख्या दर्शाती है |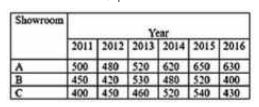 What is the average number of cars sold by showroom A over the given six years (nearest to one decimal place)?
दिए गए छः वर्षों में शोरूम A द्वारा बेची गयी कारों की औसत संख्या कितनी है ? (एक दशमलव स्थान के निकटतम )View Solution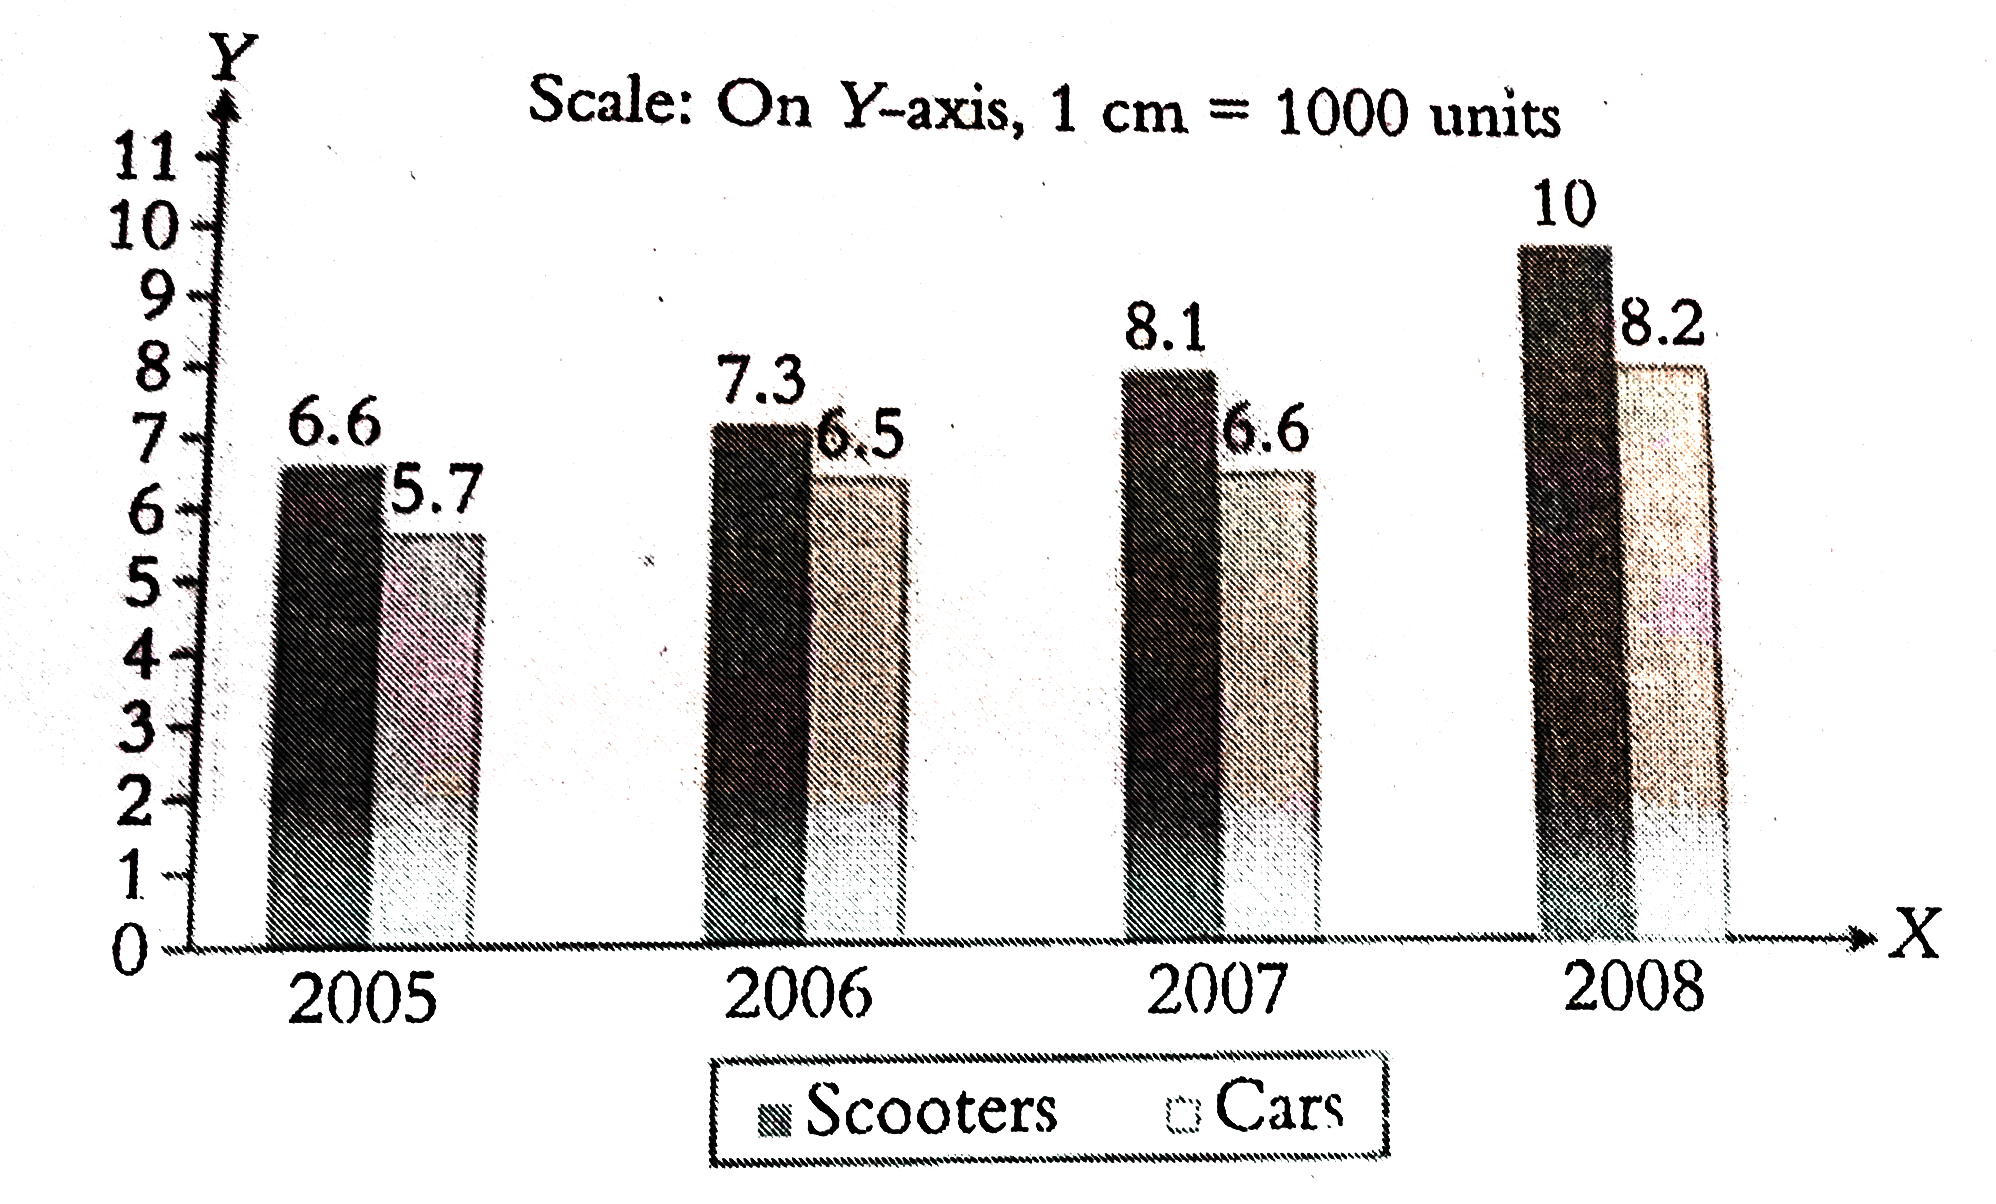
Find the ratio between the total number of vehicles sold (scooters and cars) in the year 2006 and that in the year 2008.View SolutionIf the number of cars sold of model D is 72900, then what is the total number of cars sold of all the models together by the company?
View SolutionThe given bar graph presents the sale of a particular brand of car by three showrooms, A, B and C( in multiples of 100) during the months of Jan, Feb, Mar and Apr, 2016
दिया गया दंड आरेख (बार ग्राफ) तीन शो-रूम- A, B और C के द्वारा जनवरी, फरवरी, मार्च और अप्रैल, 2016 के दौरान कार के एक खास ब्रांड की (100 के गुणक में) बिक्री को दर्शाता है|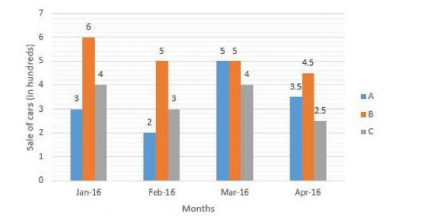 What is the ratio of the number of cars sold by A in Jan-Feb, 2016 to that of cars sold by B during Mar-Apr, 2016?
जनवरी-फरवरी, 2016 में A के द्वारा और मार्च-अप्रैल, 2016 के दौरान B के द्वारा बेची गई कारों की संख्या का अनुपात क्या है?View Solution


