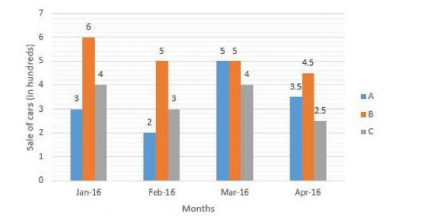
The given bar graph presents the sale of a particular brand of car by three showrooms, A, B and C( in multiples of 100) during the months of Jan, Feb, Mar and Apr, 2016
दिया गया दंड आरेख (बार ग्राफ) तीन शो-रूम- A, B और C के द्वारा जनवरी, फरवरी, मार्च और अप्रैल, 2016 के दौरान कार के एक खास ब्रांड की (100 के गुणक में) बिक्री को दर्शाता है|
 What is the ratio of the number of cars sold by A in Jan-Feb, 2016 to that of cars sold by B during Mar-Apr, 2016?
जनवरी-फरवरी, 2016 में A के द्वारा और मार्च-अप्रैल, 2016 के दौरान B के द्वारा बेची गई कारों की संख्या का अनुपात क्या है?
The correct Answer is:D
Step by step video, text & image solution for The given bar graph presents the sale of a particular brand of car by three showrooms, A, B and C( in multiples of 100) during the months of Jan, Feb, Mar and Apr, 2016 दिया गया दंड आरेख (बार ग्राफ) तीन शो-रूम- A, B और C के द्वारा जनवरी, फरवरी, मार्च और अप्रैल, 2016 के दौरान कार के एक खास ब्रांड की (100 के गुणक में) बिक्री को दर्शाता है| What is the ratio of the number of cars sold by A in Jan-Feb, 2016 to that of cars sold by B during Mar-Apr, 2016? जनवरी-फरवरी, 2016 में A के द्वारा और मार्च-अप्रैल, 2016 के दौरान B के द्वारा बेची गई कारों की संख्या का अनुपात क्या है? by Maths experts to help you in doubts & scoring excellent marks in Class 14 exams.
Topper's Solved these Questions
Similar Questions
Find the simple interest and compound interest on Rs 10000 for 2 years at the rate of 10%?
01:47View SolutionIn triangle PQR, the internal bisector of ∠Q and ∠R meets at 0. If ∠QPR=70∘, then what is the value (in degrees) of ∠QOR?
02:14View SolutionThe given Bar Graph presents the Target and Actual production of AC Machines (numbers in thousands) of a factory over five months. दिया गया दंड आरेख पांच महीनों के दौरान एक फैक्ट्री में एसी मशीनों के उत्पादन का लक्ष्य तथा वास्तविक उत्पाद को दर्शाता है | The ratio of the combined target production of AC Machines in January and April to that of the combined actual production of AC Machines in March and April was: जनवरी और अप्रेल में एसी मशीनों के उत्पादन के संयुक्त लक्ष्य तथा मार्च और अप्रैल में एसी मशीनों के वास्तविक संयुक्त उत्पादन में क्या अनुपात है ?
02:28View SolutionThe given Bar Graph presents the Imports and Exports of an item (in tonnes) manufactured by a company for the five financial years, 2013-2014 to 2017-2018. दिया गया दंड आरेख पांच वित्तीय वर्षो अर्थत 2013-2014 से 2017-2018 तक एक कंपनी के द्वारा निर्मित किसी वस्तु के आयात और निर्यात ( टन में ) को दर्शाता है | What is the ratio of total Imports to total Exports during 2014-2015,2015-2016 and 2016-2017? 2014-2015, 2015-2016 और 2016-2017 के दौरान कुल आयात तथा कुल निर्यात के बीच अनुपात ज्ञात करें |
01:40View SolutionThe given Bar Graph presents the sale (in 1000 kg) of a particular brand of tea by three outlets. A, B and C during the months feb, Mar and Apr,2018 दिया गया दंड आरेख तीन आउटलेट A, B और C के द्वारा तीन महीनों : फरवरी, मार्च और अप्रैल 2018 में एक विशेष ब्रांड की चाय की बिक्री ( हज़ार किलो ग्राम में ) को दर्शाता है | What is the ratio of rate of growth in sales from B to the rate of growth in sales from C in Mar 2018 with reference to its previous month? पिछले माह की तुलना में मार्च 2018 में B की बिक्री में वृद्धि का C की बिक्री में वृद्धि के साथ अनुपात ज्ञात करें |
03:00View SolutionThe given Bar Graph presents the sale (in 1000 kg) of a particular brand of tea by three outlets. A, B and C during the months feb, Mar and Apr,2018 दिया गया दंड आरेख तीन आउटलेट A, B और C के द्वारा तीन महीनों : फरवरी, मार्च और अप्रैल 2018 में एक विशेष ब्रांड की चाय की बिक्री ( हज़ार किलो ग्राम में ) को दर्शाता है | What is the average sale per1 month by A during Jan-Mar, 2018? जनवरी से मार्च 2018 तक A की प्रतिमाह औसत बिक्री कितनी रही है ?
02:23View SolutionThe given Bar Graph presents the sale (in 1000 kg) of a particular brand of tea by three outlets. A, B and C during the months feb, Mar and Apr,2018 दिया गया दंड आरेख तीन आउटलेट A, B और C के द्वारा तीन महीनों : फरवरी, मार्च और अप्रैल 2018 में एक विशेष ब्रांड की चाय की बिक्री ( हज़ार किलो ग्राम में ) को दर्शाता है | By how much By how much quantity is the average sale per month from B more or less than that from C? B की प्रतिमाह औसत बिक्री C की प्रतिमाह औसत बिक्री से कितनी अधिक या कम है ?
02:35View SolutionThe given Bar Graph presents the data of annual income (A) and annual expenditure (B) of an IT officer in a multi-national company during the years 2012 to 2016. दिया गया दंड आरेख वर्ष 2012 से 2016 के दौरान किसी बहुराष्ट्रीय कंपनी में कार्यरत एक आईटी अधिकारी अधिकारी की वार्षिक आय ( A ) और वार्षिक व्यय (B) के आंकड़ों को दर्शाता है | What was his average monthly savings (in Rs) in 2015 and 2016, taken together (correct to two decimal places)? 2015 और 2016 को मिलाकर उसकी औसत मासिक बचत ( रुपये में ) कितनी थी ? ( दशमलव के दो स्थान तक )
01:43View SolutionThe given Bar Graph presents the data of annual income (A) and annual expenditure (B) of an IT officer in a multi-national company during the years 2012 to 2016. दिया गया दंड आरेख वर्ष 2012 से 2016 के दौरान किसी बहुराष्ट्रीय कंपनी में कार्यरत एक आईटी अधिकारी अधिकारी की वार्षिक आय ( A ) और वार्षिक व्यय (B) के आंकड़ों को दर्शाता है | What is the ratio between the ratios of savings to expenditure, respectively for the periods 2012-13 and 2015-16? बचत और व्यय के अनुपात के बीच क्रमशः वर्ष 2012-13 और 2015-16 के लिए अनुपात ज्ञात करें |
03:36View SolutionThe given Bar Graph presents Income and Expenditure (in crores of Rupees) of a company for five years, 2014 to 2018. What is the ratio of total Expenditure to total Income of the company in 2014,2016 and 2017? दिया गया दंड आरेख (बार ग्राफ) 5 वर्षों, 2014 से 2018 के दौरान किसी कंपनी की आय और व्यय (करोड़ रुपए में) को दर्शाता है| 2014, 2016 और 2017 में कंपनी के कुल व्यय और कुल आय का अनुपात क्या है?
01:32View SolutionThe given Bar Graph present the Imports and Exports of an item (in tonnes) manufactured by a company for the five financial years, 2013-2014 to 2017-2018. दिया गया दंड आरेख (बार ग्राफ) पांच वित्त वर्षों, 2013-2014 से 2017-2018, के दौरान किसी कंपनी दवारा निर्यात किसी वस्तु (टन में] के आयात और निर्यात को दर्शाता है| What is the ratio of total Imports to total Exports during 2014- 2015, 2015- 2016 and 2016- 2017? वर्ष 2014-2015, 2015-2016 33 2016-2011 के दौरान, कुल आयात और निर्यातों का अनुपात कितना है?
03:27View SolutionThe given Bar Graph presents the number of students of two schools for six years. दिया गया दंड आरेख (बार ग्राफ) छह वर्षो के दौरान दो स्कूलों में विद्यार्थियों की संख्या को दर्शाता है| What is the ratio of the students taken for all years together from school B to that from school A? सभी वर्षों के दौरान स्कूल B और स्कूल A के कुत्र विद्यार्थियों का अनुपात क्या है?
03:59View SolutionThe given Bar Graph presents the number of students of two schools for six years. दिया गया दंड आरेख (बार ग्राफ) छह वर्षो के दौरान दो स्कूलों में विद्यार्थियों की संख्या को दर्शाता है| What is the average number of students from school B during the six year period (correct to two decimal places)? छह वर्षों की अवधि के दौरान स्कूल B के विद्यार्थियों की औसत संख्या कितनी है [दो दशमलव स्थानों तक सही )?
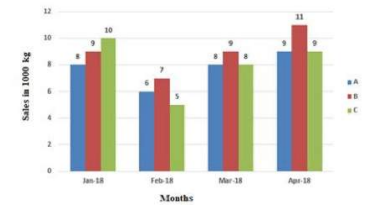
03:58View SolutionThe given Bar Graph presents the sale (in 1000kg) of a particular brand of tea by three outlets, A, B and C during the months of Jan, Feb, Mar and Apr, 2018.
दिया गया दंड आरेख (बार ग्राफ) तीन विक्रय केंद्रों A, B और C के दवारा चाय के किसी खास ब्रांड की जनवरी , फरवरी ,मार्च और अप्रैल ,2018 के दौरान (1000 kg में ) बिक्री को दर्शाता है | What is the ratio of the rate of growth in sales from B to the rate of growth in sales from C in Mar 2018 with reference to its previous month?
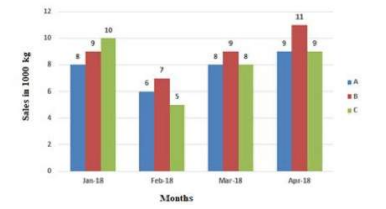
पिछले महीने की तुलना में ,मार्च 2018 में B की बिक्री वृद्धि-दर तथा C की बिक्री वृद्धि-दर का क्या अनुपात है ?03:00View SolutionThe given Bar Graph presents the sale (in 1000kg) of a particular brand of tea by three outlets, A, B and C during the months of Jan, Feb, Mar and Apr, 2018.
दिया गया दंड आरेख (बार ग्राफ) तीन विक्रय केंद्रों A, B और C के दवारा चाय के किसी खास ब्रांड की जनवरी , फरवरी ,मार्च और अप्रैल ,2018 के दौरान (1000 kg में ) बिक्री को दर्शाता है | By how much quantity is the average sale per month from B more or less than that from C?
B की प्रति माह औसत बिक्री की मात्रा, C की तुलना में कितना अधिक अथवा कम है?01:57View SolutionThe given bar graph presents the sale of a particular brand of car by three showrooms, A, B and C( in multiples of 100) during the months of Jan, Feb, Mar and Apr, 2016
दिया गया दंड आरेख (बार ग्राफ) तीन शो-रूम- A, B और C के द्वारा जनवरी, फरवरी, मार्च और अप्रैल, 2016 के दौरान कार के एक खास ब्रांड की (100 के गुणक में) बिक्री को दर्शाता है| What is the ratio of the number of cars sold by A in Jan-Feb, 2016 to that of cars sold by B during Mar-Apr, 2016?
जनवरी-फरवरी, 2016 में A के द्वारा और मार्च-अप्रैल, 2016 के दौरान B के द्वारा बेची गई कारों की संख्या का अनुपात क्या है?04:14View Solution

