Study the given bar graph carefully and answer the questions given below
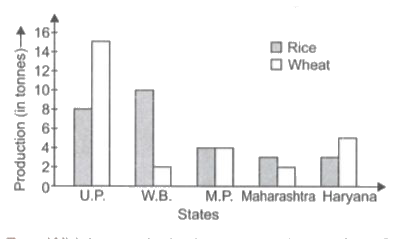
Which state has the total production of rice and wheat as its maximum?
U.P
Maharashtra
Haryana
W.B
The correct Answer is:A
Step by step video & image solution for Study the given bar graph carefully and answer the questions given below Which state has the total production of rice and wheat as its maximum? by Maths experts to help you in doubts & scoring excellent marks in Class 6 exams.
Topper's Solved these Questions
- BOOK - SCIENCE OLYMPIAD FOUNDATION CHAPTER - DATA HANDLINGEXERCISE - Achievers section (Hots)5videos
DATA HANDLING
- BOOK - SCIENCE OLYMPIAD FOUNDATION CHAPTER - CLASS 6 SAMPLE PAPER FINAL 4EXERCISE - Section A- Mathematics10videos
CLASS 6 SAMPLE PAPER FINAL 4
- BOOK - SCIENCE OLYMPIAD FOUNDATION CHAPTER - DECIMALS EXERCISE - Achievers Section (Hots)5videos
DECIMALS
Similar Questions
Look at the bar graph given below:
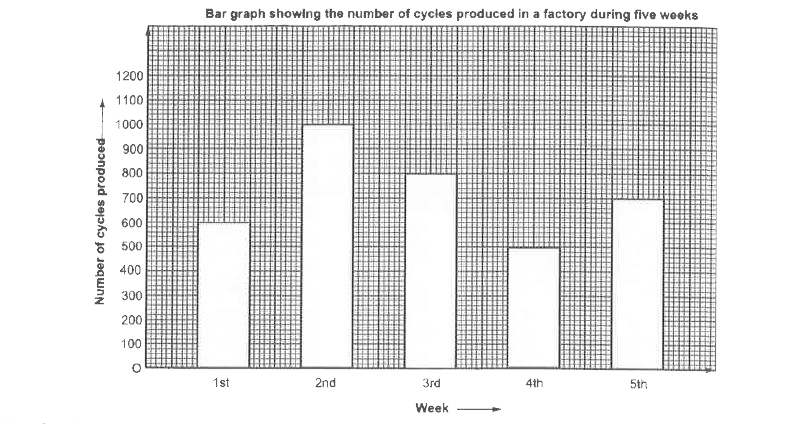
Study the bar graph carefully and answer the question given below:
In which week was the production maximum ?
What is the average production during these five weeks ?
How many cycles were produced in the first 3 weeks ?View SolutionRead the following graph carefully and answer the questions given below.
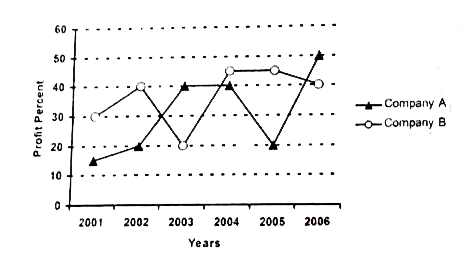
In which year the average of the profit percent of the both companies was the maximum ?View Solution
Knowledge Check
- Question 1 - Select One
Examine the following graph carefully and answer the questions given below it :
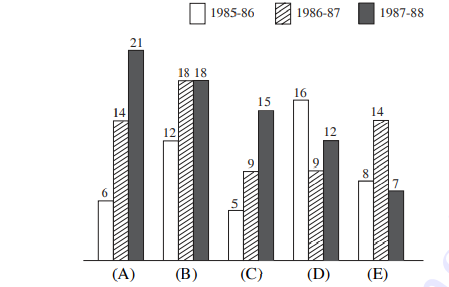
In which states is there a steady increase in the production of cotton during the given period ?AA and BBA and CCB onlyDD and E - Question 2 - Select One
Study the following graph carefully and answer the questions given below
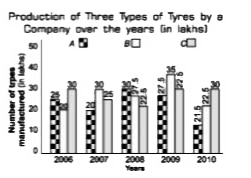
The total production of C type tyres in 2006 and 2007 together was what percentage of pro- duction of B type tyres in 2008?A50%B100%C150%D200% - Question 3 - Select One
Study the following graph carefully and answer the questions given below
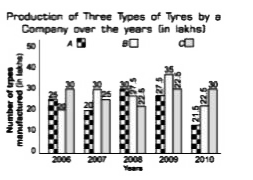
In which of the following years, was the percentage production of B type to C type the maximum?A2008B2009C2010D2007
The circle - graph given here shows the spendings of a country on various sports during a prticular year. Study the graph carefully and answer the questions given below It .
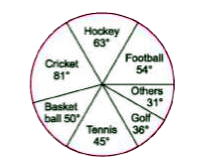
What per cent of the total spendings is Sent on Tennis ?View SolutionStudy the following graph carefully and answer the question given below-----
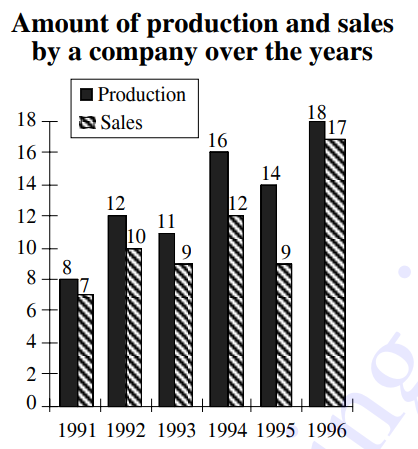
What was the percentage drop in sales from 1992 to 1993 ?View SolutionThe circle graph given here shows the spendings of a country on various sports during a particular year, study the graph carefully and answer the questions given below it.
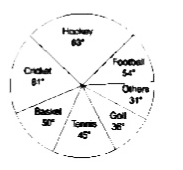
What per cent of the total spendings is spent on tennis ?View SolutionStudy the following graph carefully and answer the questions given below
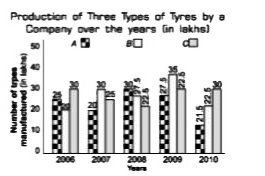
The total number of all the three types of tyres manufactured was the least in which of the following years?View SolutionStudy the given bar graph carefully and answer the questions based on it.
Production (in lakh tonne) of wheat from 2005-10
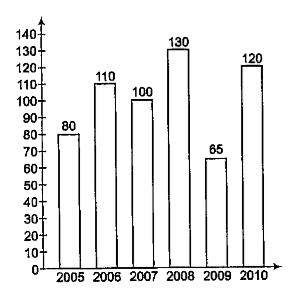
What is the mean production for all the years?View Solution

