Look at the bar graph given below:
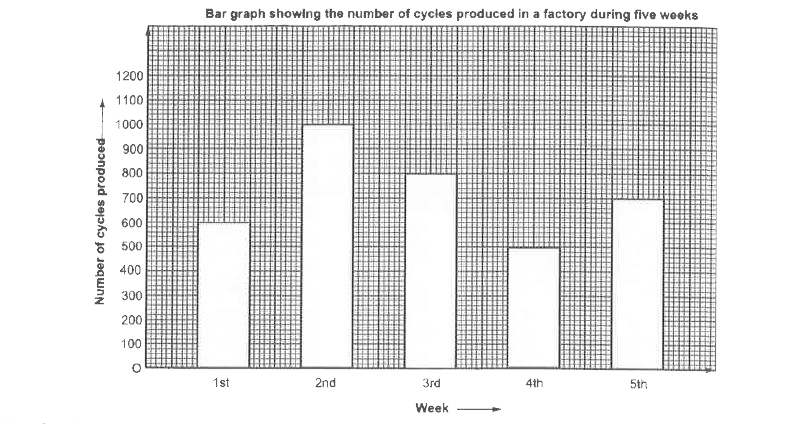
Study the bar graph carefully and answer the question given below:
In which week was the production maximum ?
What is the average production during these five weeks ?
How many cycles were produced in the first 3 weeks ?
The correct Answer is:(i) The production was maximum in the 3nd week.
(ii) The production was minimum in the 4th week.
(iii) The average production is 720 per week.
(iv) 2400 cycles were production in the first three weeks.
Step by step video, text & image solution for Look at the bar graph given below: Study the bar graph carefully and answer the question given below: In which week was the production maximum ? What is the average production during these five weeks ? How many cycles were produced in the first 3 weeks ? by Maths experts to help you in doubts & scoring excellent marks in Class 6 exams.
Updated on:21/07/2023Topper's Solved these Questions
- BAR GRAPH BOOK - RS AGGARWALCHAPTER - BAR GRAPH EXERCISE - EXERCISE
4 Videos
- ANGLES AND THEIR MEASUREMENTBOOK - RS AGGARWALCHAPTER - ANGLES AND THEIR MEASUREMENTEXERCISE - EXERCISE D
13 Videos
- CIRCLESBOOK - RS AGGARWALCHAPTER - CIRCLESEXERCISE - C. WRITE T FOR TRUE AND F FOR FALSE FOR EACH OF THE STATEMENTS GIVEN BELOW:
1 Videos
Similar Questions
Study the following graph and answer the questions given below it.
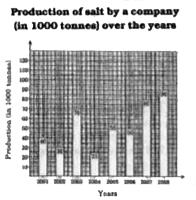
In how many of the given years was the production of salt more than the average production of the given years?
View Solution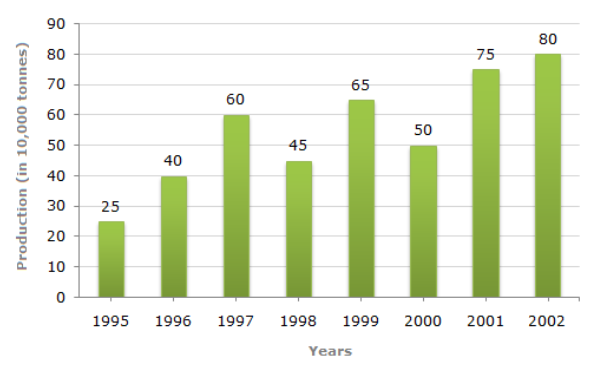
Study the bar chart and answer the question based on it. In how many of the given years was the production of fertilizers less than the average production of the given years?
View Solution
Knowledge Check
Study the following graph carefully and answer the questions given below it -----
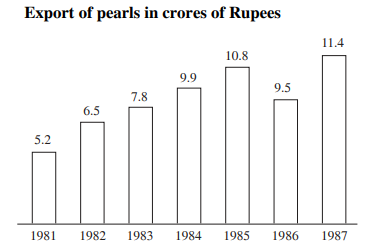
In how many years was the export above the average for the given period ?A2B3C4D5Study the following graph carefully and answer the questions given below
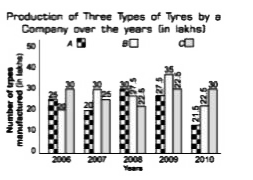
In which of the following years, was the percentage production of B type to C type the maximum?A2008B2009C2010D2007Study the following graph and answer these questions given below:-
Tea in India (in million kg.)
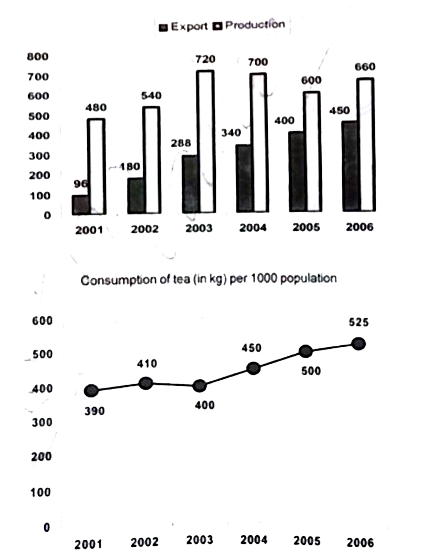
What was approximately the average production during the period?A650 millionB625 millionC600 millionD616 million
Examine the following graph carefully and answer the questions given below it :
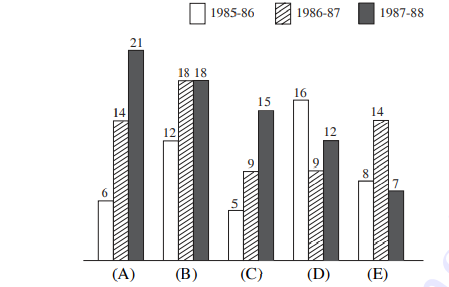
In which states is there a steady increase in the production of cotton during the given period ?
View SolutionStudy the given bar graph carefully and answer the questions based on it.
Production (in lakh tonne) of wheat from 2005-10
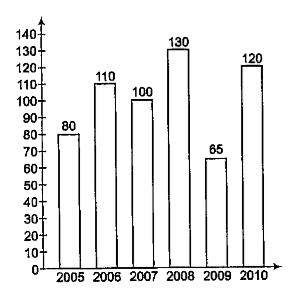
What is the mean production for all the years?
View SolutionStudy the following graph and answer questions
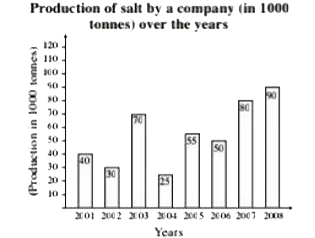
In how many of the given years was the production of salt more than the average production of the given years?
View SolutionStudy the following graph carefully to answer the questions given below.
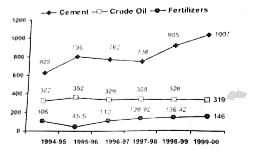
What is the difference between the average cement production and the average crude oil production during the given years (in lakh tonnes)?
View SolutionStudy the graph carefully and answer the questions below it -----
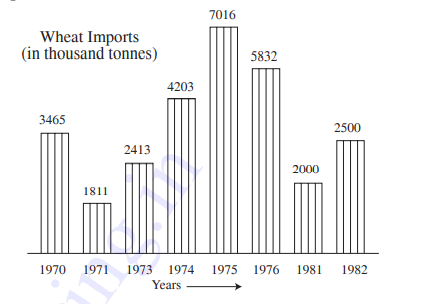
The imports in 1974 is approximately what percent of the average imports for the given years ?
View Solution
