The given bar graph shows the sale of different brands of shirts in a shop in one month .

(i) How many total shirts are sold in the month?
(ii) Find the fraction of number of shirts sold of brand S to the number of shirts sold of brand P and R together.
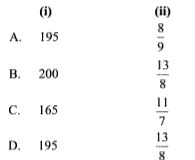
The correct Answer is:D
(i) Total number of shirts sold in the month
=15+35+25+65+55=195.
(ii) Number of shirts sold of brand S= 65
Number of shirts sold brand P=15
Number of shirt sold of brand R= 25
Number of shirts sold of brand P and R together =15+25=40
∴ Required fraction =6540=138
Topper's Solved these Questions
- BOOK - SCIENCE OLYMPIAD FOUNDATION CHAPTER - IMO QUESTION PAPER 2018-19 SET AEXERCISE - Everyday mathematics10videos
IMO QUESTION PAPER 2018-19 SET A
- BOOK - SCIENCE OLYMPIAD FOUNDATION CHAPTER - IMO QUESTION PAPER 2017-18 SET - BEXERCISE - ACHIEVERS SECTION5videos
IMO QUESTION PAPER 2017-18 SET - B
- BOOK - SCIENCE OLYMPIAD FOUNDATION CHAPTER - IMO QUESTION PAPER 2018-19 SET BEXERCISE - Everyday Mathematics15videos
IMO QUESTION PAPER 2018-19 SET B
Similar Questions
The given bar graph shows the sale of different brands of shirts in a shop in one month.
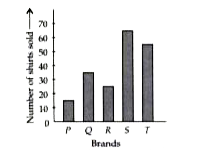
Find the ratio of number of shirts sold of brand S to the number of shirts sold or brand P and R together.
{ ((a),8:9),((b)13:8),((c )11:7),((d)13:6): }View SolutionThe bar graph shows the number of cars of different brands sold by a dealer in a month. Study the diagram and answer the following question.
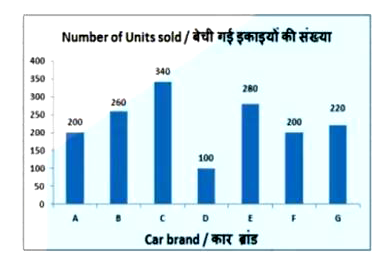
What is the ratio of units sold of brand G to that of brand E?View Solution
Knowledge Check
- Question 1 - Select One
The bar graph shows 1 month's sales of different brands of washing machines of a certain electronics store in Rs. 1000s. Study the diagram and answer the following questions.
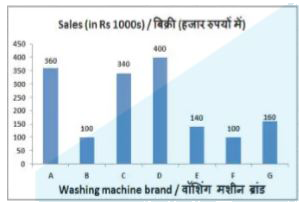
What is the ratio of sales of brand G to that of brand A?A9:4B1:2C2:1D4:9 - Question 2 - Select One
The bar graph shows 1 month's sales figure of different brands of refrigerator of a certain electronic store in Rs 1000s. Study the diagram and answer the following questions.
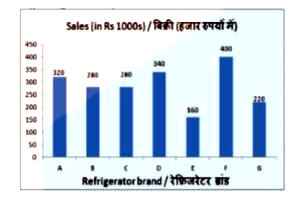
What is the ratio of sales of brand B to that of brand E?Aa. 7:4Bb. 4:7Cc. 4:1Dd. 1:4 - Question 3 - Select One
The bar graph shows 1 month's sales figure of different brands of refrigerator of a certain electronic store in Rs 1000s. Study the diagram and answer the following questions.

What is the ratio of sales of brand B to that of brand E?A7:4B4:7C4:1D1:4
The bar graph shows the number of motorcycles of different brands sold by a dealer in a month . Study the diagram and answer the following questions .
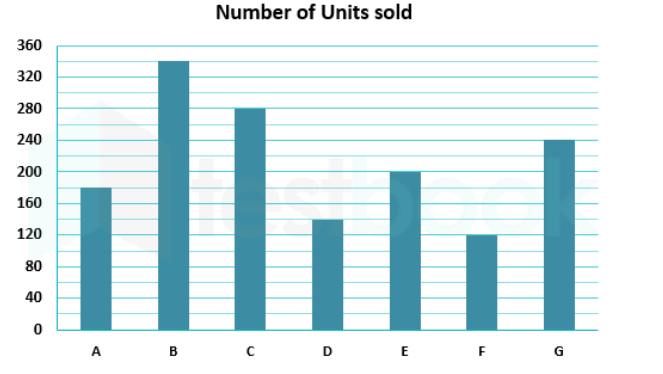
What is the ratio of units sold of brand A to that of brand C?View SolutionThe given bar graph represents the sale of cars in five different states in a month.
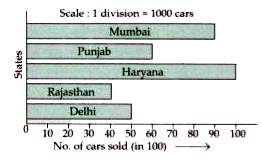
Which state sold 5000 cars ?View SolutionDirection: The given bar graph shows the number of pens sold by two shops A & B in four consecutive months. Study the following data and answer the following questions:
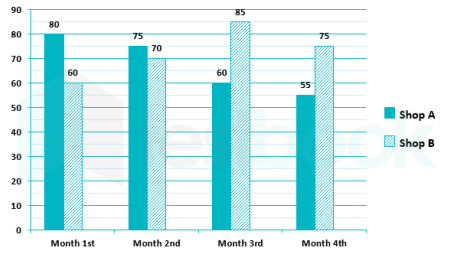
Find the ratio of the number of pens sold by shop A in 1st month to the number of pens sold by B in 3rd month.View SolutionThe given bar graph represents the sale of cars in five different states in a month.
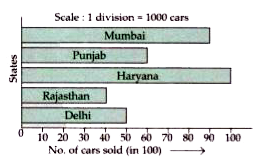
Which state sold maximum number of cars ?View Solution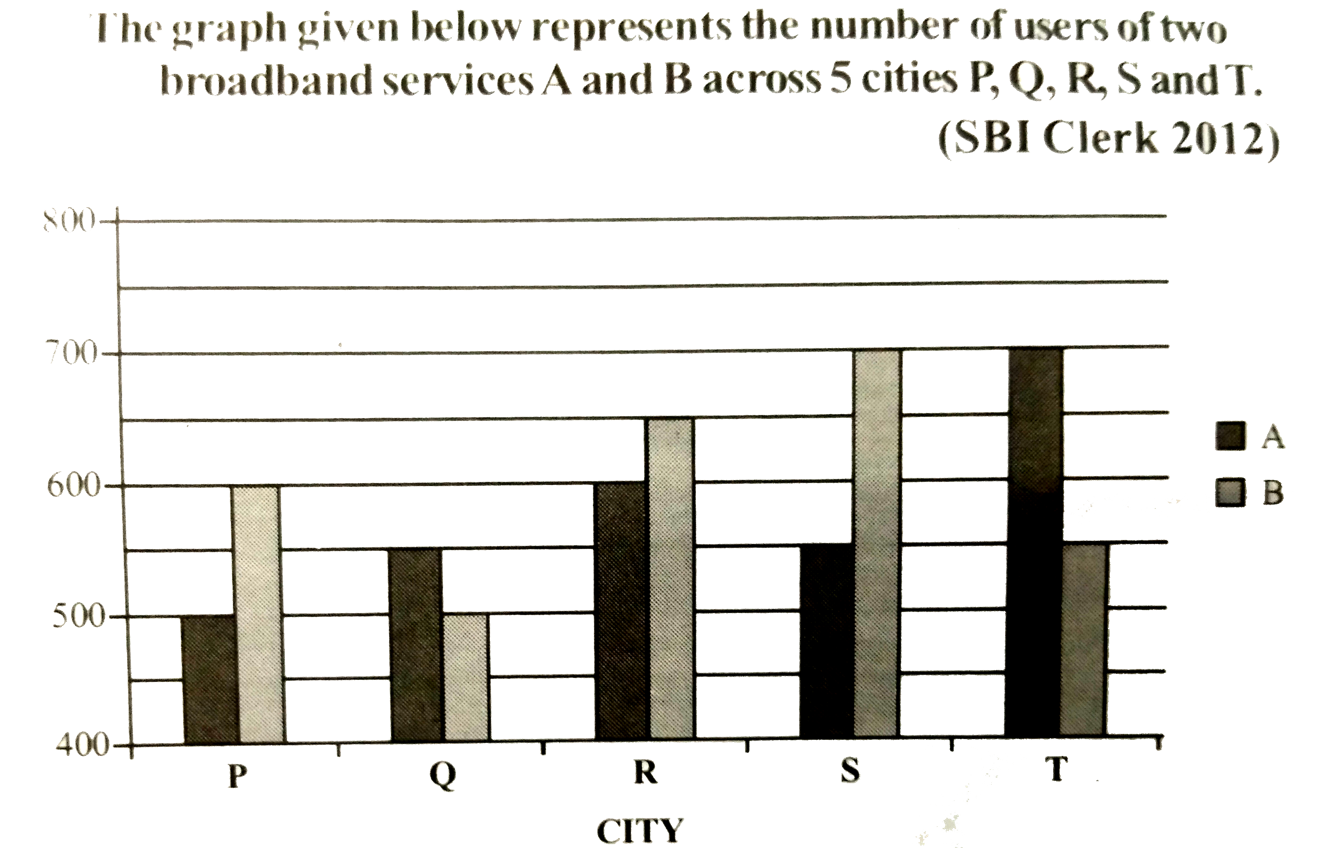
What is the difference between the total number of users of Brand A and B together in city R and the total number of users of brand A annd B together in city P ?View Solution

