The given bar graph shows the sale of different brands of shirts in a shop in one month.
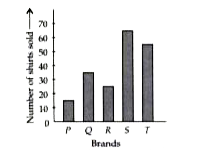
Find the ratio of number of shirts sold of brand S to the number of shirts sold or brand P and R together.
{
((a),8:9),((b)13:8),((c )11:7),((d)13:6): }
Step by step video & image solution for The given bar graph shows the sale of different brands of shirts in a shop in one month. Find the ratio of number of shirts sold of brand S to the number of shirts sold or brand P and R together. { ((a),8:9),((b)13:8),((c )11:7),((d)13:6): } by Maths experts to help you in doubts & scoring excellent marks in Class 6 exams.
Updated on:21/07/2023Topper's Solved these Questions
- DATA HANDLING BOOK - MTG IIT JEE FOUNDATIONCHAPTER - DATA HANDLING EXERCISE - NCERT Section (Exercise 9.3)
11 Videos
- DATA HANDLING BOOK - MTG IIT JEE FOUNDATIONCHAPTER - DATA HANDLING EXERCISE - NCERT Section (Exercise 9.4)
4 Videos
- DATA HANDLING BOOK - MTG IIT JEE FOUNDATIONCHAPTER - DATA HANDLING EXERCISE - NCERT Section (Exercise 9.1)
22 Videos
- BASIC GEOMETRICAL IDEASBOOK - MTG IIT JEE FOUNDATIONCHAPTER - BASIC GEOMETRICAL IDEASEXERCISE - OLYMPIAD/HOTS CORNER
10 Videos
- DECIMALSBOOK - MTG IIT JEE FOUNDATIONCHAPTER - DECIMALSEXERCISE - OLYMPIAD/HOTS CORNER
20 Videos
Similar Questions
Knowledge Check
The bar chart given below shows the number of cars sold by brand A and B for the year for 2008 to 2016
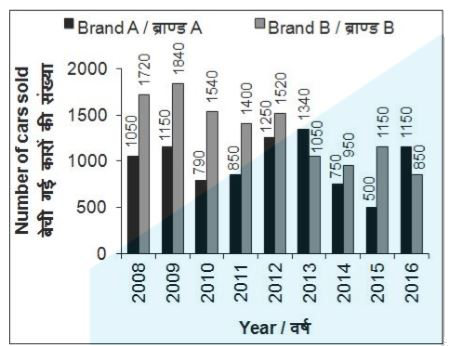
In how many years, the number of cars sold by brand A is more than the number of cars sold by brand B?A1B2C3D5
The bar graph shows the number of cars of different brands sold by a dealer in a month. Study the diagram and answer the following question.
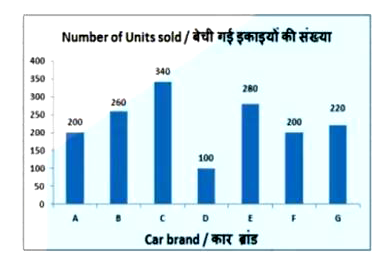
What is the ratio of units sold of brand G to that of brand E?
View SolutionThe bar graph shows the number of motorcycles of different brands sold by a dealer in a month . Study the diagram and answer the following questions .
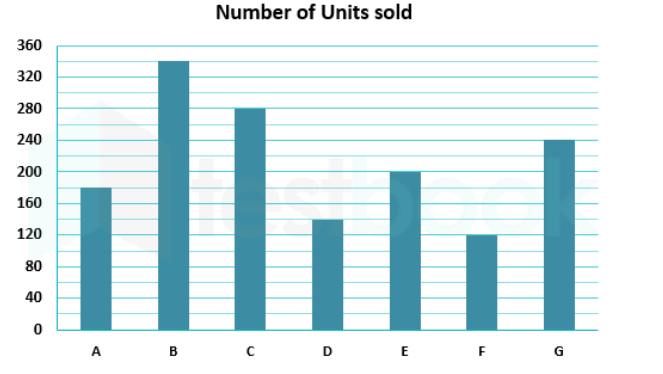
What is the ratio of units sold of brand A to that of brand C?
View SolutionThe bar graph shows the number of cars of different brands sold by a dealer in a month. Study the diagram and answer the following question.
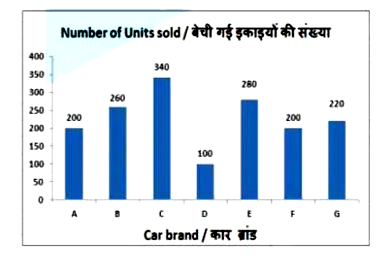
Units sold of which car brand were the second highest?
View SolutionThe bar graph shows the number of cars of different brands sold by a dealer in a month. Study the diagram and answer the following questions.
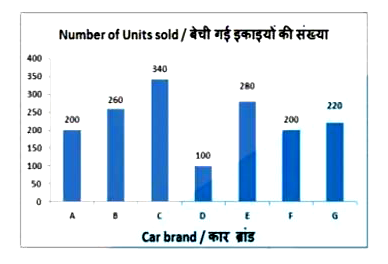
Units sold of brand D was lesser than that of brand F by _______.
View Solution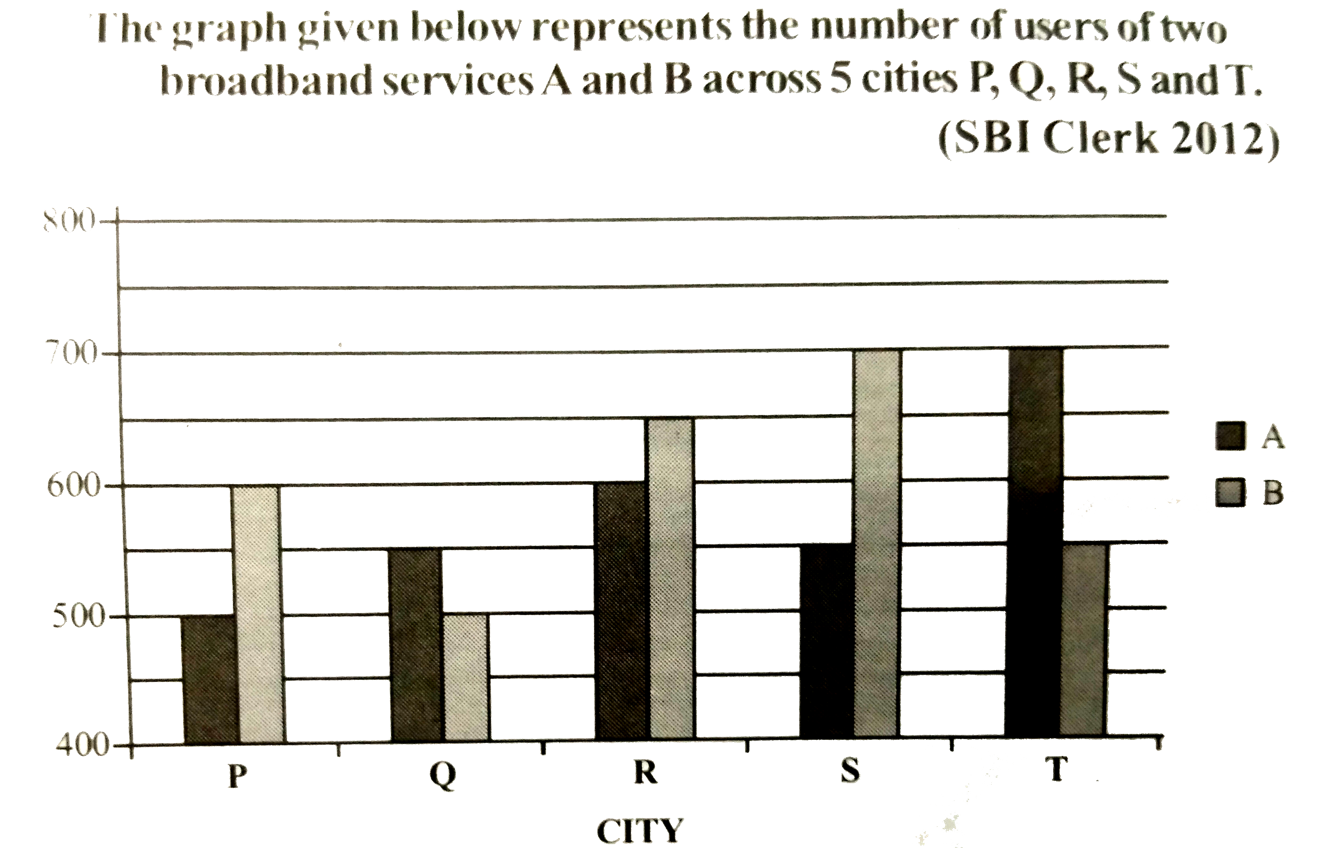
What is the difference between the total number of users of Brand A and B together in city R and the total number of users of brand A annd B together in city P ?
View SolutionThe bar graph shows the number of motorcycles of different brands sold by dealer in a month . Study the diagram and answer the following questions.

Units sold of brand D was lesser than that of brand E by _______.
View SolutionThe given double bar graph shows the sale of mobile phone and cars from 2005 to 2008
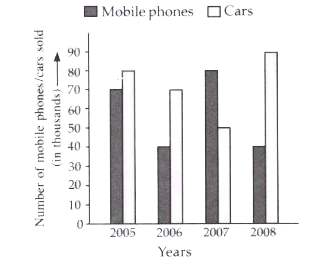
(i) Find the ratio of the tatal number of mobile phones sold in 2006 and 2008 to the total number of cars sold in 2005 and 2007
(ii) What is the average number of cars sold from 2005 to 2008
View Solution

