The given bar graph shows the area under the rice crop during different years in India. Study the graph carefully and answer the following questions.
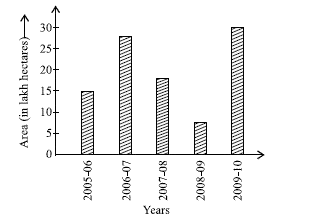
What is the average area (in hectares) under the rice crop during the years 2005-2008?
2000000
2500000
4500000
3000000
The correct Answer is:A
Step by step video, text & image solution for The given bar graph shows the area under the rice crop during different years in India. Study the graph carefully and answer the following questions. What is the average area (in hectares) under the rice crop during the years 2005-2008? by Maths experts to help you in doubts & scoring excellent marks in Class 10 exams.
Topper's Solved these Questions
- BOOK - SCIENCE OLYMPIAD FOUNDATION CHAPTER - IMO QUESTION PAPER 2018 SET AEXERCISE - Everyday Mathematics10videos
IMO QUESTION PAPER 2018 SET A
- BOOK - SCIENCE OLYMPIAD FOUNDATION CHAPTER - IMO QUESTION PAPER 2018 SET AEXERCISE - Achievers section5videos
IMO QUESTION PAPER 2018 SET A
- BOOK - SCIENCE OLYMPIAD FOUNDATION CHAPTER - IMO QUESTION PAPER 2017 SET-BEXERCISE - Achievers Section5videos
IMO QUESTION PAPER 2017 SET-B
- BOOK - SCIENCE OLYMPIAD FOUNDATION CHAPTER - IMO QUESTION PAPER 2018 SET BEXERCISE - ACHIEVERS SECTION5videos
IMO QUESTION PAPER 2018 SET B
Similar Questions
Knowledge Check
- Question 1 - Select One
Study the graph carefully and answer the following questions.
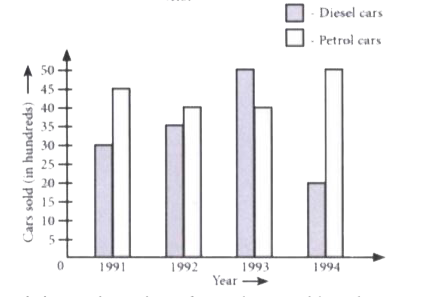
How many cars were sold during the year 1991?A9000B6500C7500D7000 - Question 2 - Select One
Study the graph carefully and answer the following questions.
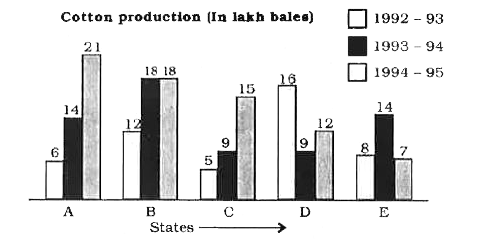
What is the average production of the four states in the year 1994-95 taken together ?A12.3B14.6C15.6D16.3 - Question 3 - Select One
Study the following graph carefully and answer the questions that
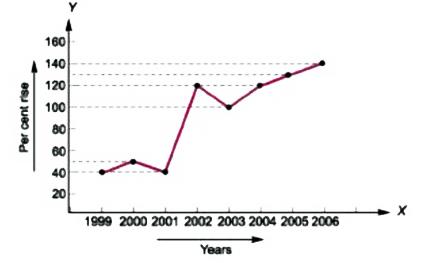
What was the average of percent rise over the given years ?A1.1B1.05C100.5%D92.5%
Study the following graph carefully and answer the given questions.
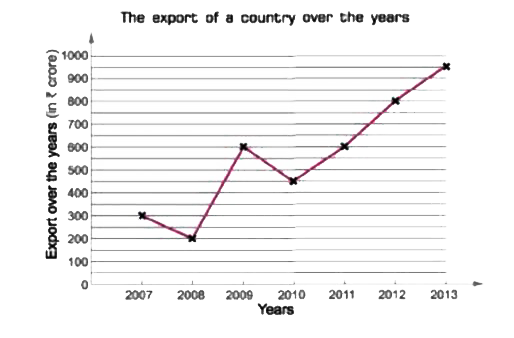
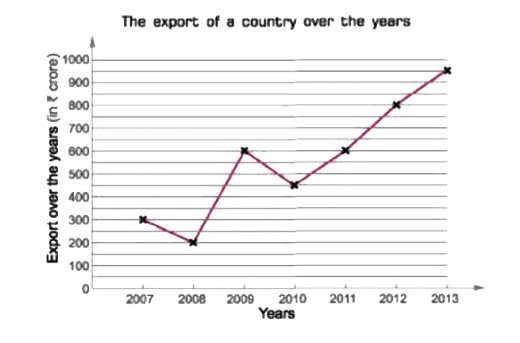
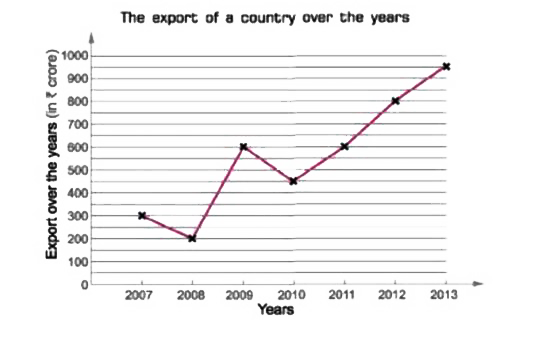
What is the percentage increase in exports from the lowest to the highest for the given years ?View SolutionFollowing graph shows the income of a company in six different years. Study the graph , carefully and answer the questions that follow.
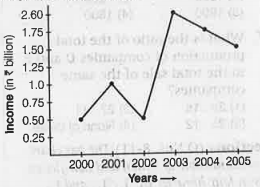
What is the ratio of the income of the company in the years 2000 and 2005 ?View SolutionStudy the graph and answer the following questions-
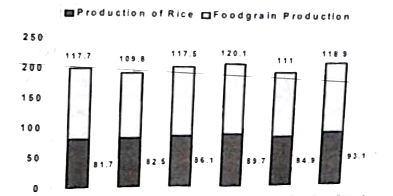
Over the given years what is average production of rice?View SolutionThe given bar graph shows the biscuit exports of India over a period of five years. Study the graph and answer the questions that follows
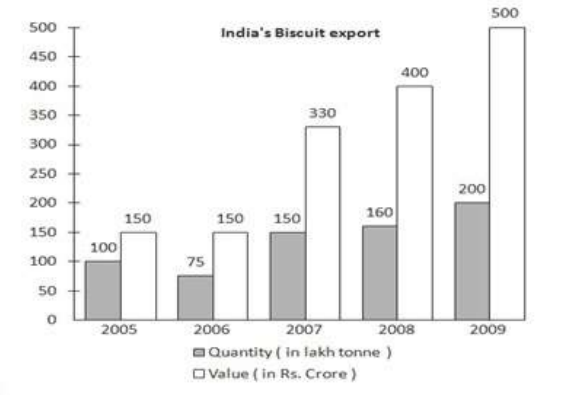
In which two year was the value per tonne equal?View SolutionStudy the following graph carefully and answer the questions that follow
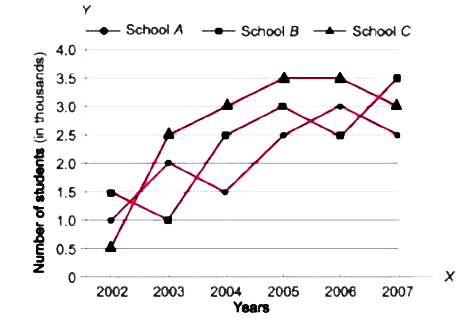
What was the average number of students in all schools together in the year 2006 ?View Solution


