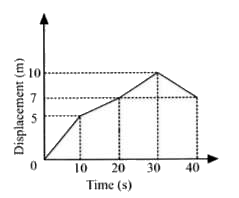
Study the displacement time graph of a toy car given here and choose the correct statements from the following.

I. The toy car is the fastest during the first 10 seconds. II. The toy car is the slowest in between 10 seconds and 20 seconds. III. Distance travelled by the car is 3 m during the time interval 30 seconds to 40 seconds. IV. Total distance covered by the toy car is 10 m.
I and II only
III and IV only
I, II and III only
I, II, III and IV
The correct Answer is:C
I, II and III only
Topper's Solved these Questions
Similar Questions
Knowledge Check
A car wheel 60 cm in diameter is turning at 8 revolutions per seconds .When the car begins to slow uniformly to rest in a time of 14 seconds Distance travelled by the car in this time is
A211.2 mB105.6 mC52.8 mD422. 4 m
A car acquires a velocity of 72km/h in 10 seconds starting from rest. Find (a) the acceleration (b) the average speed ( c ) the distance travelled in this time.
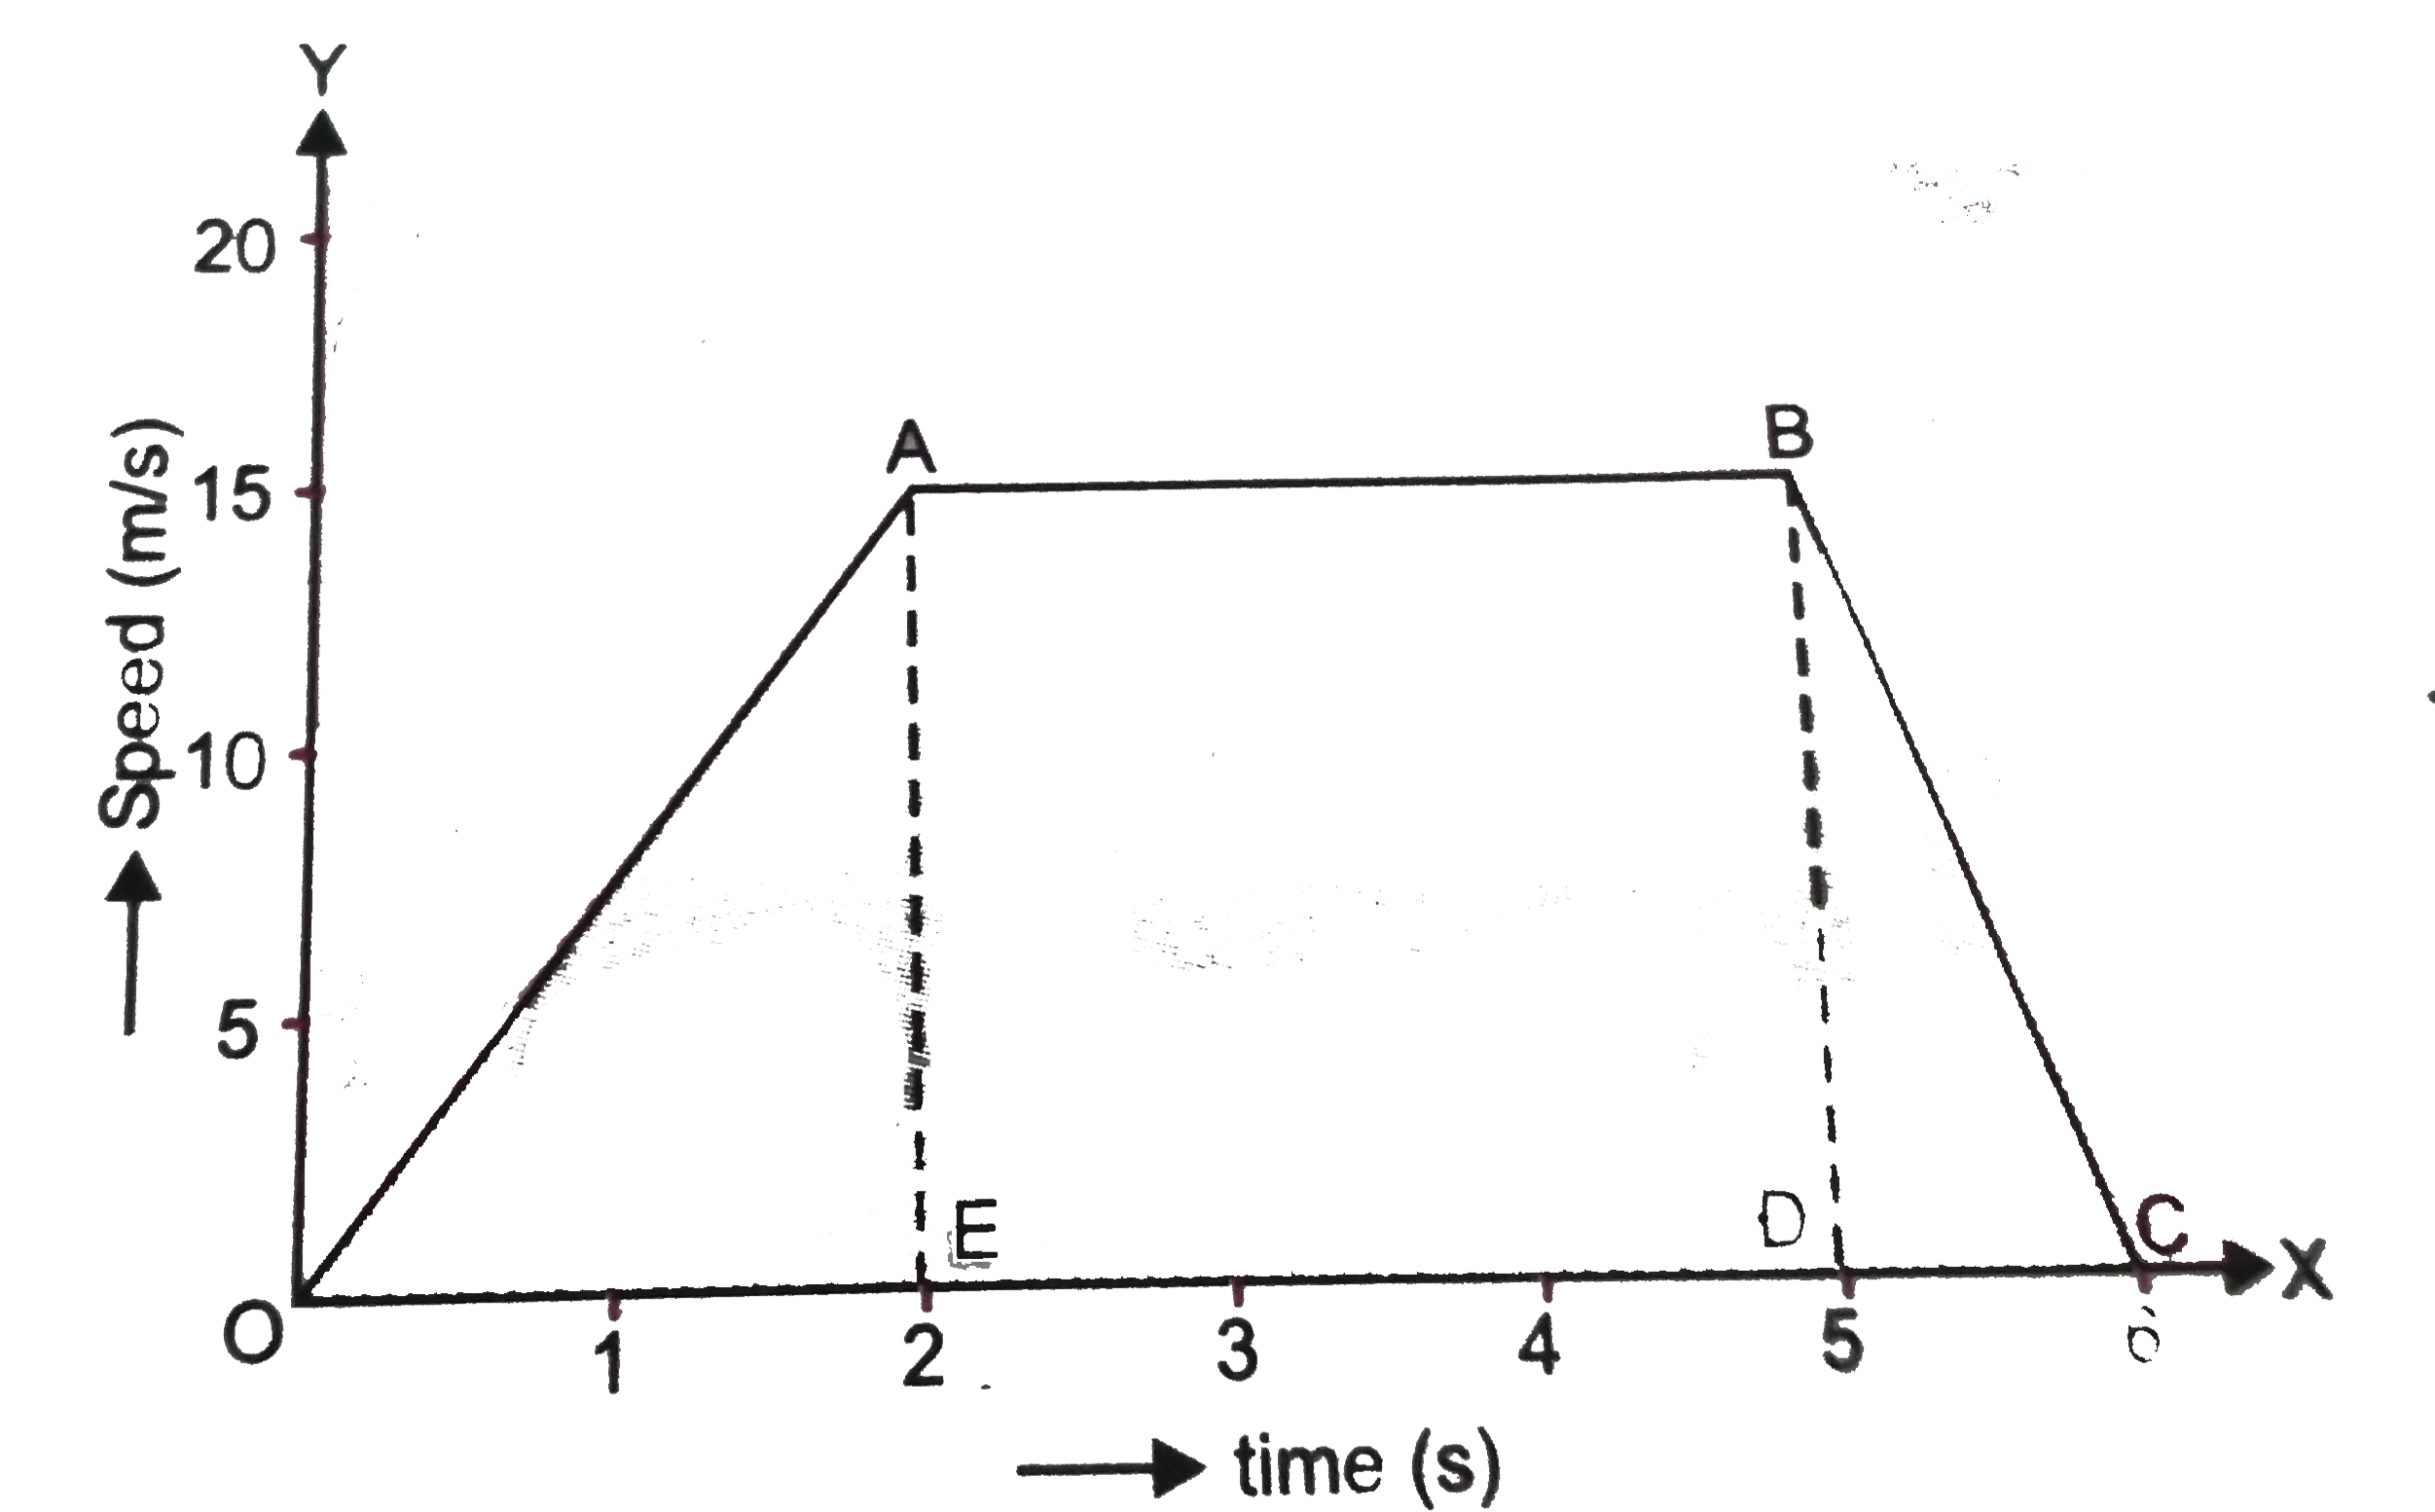
View SolutionThe speed of a car as a function of time is shown in figure.
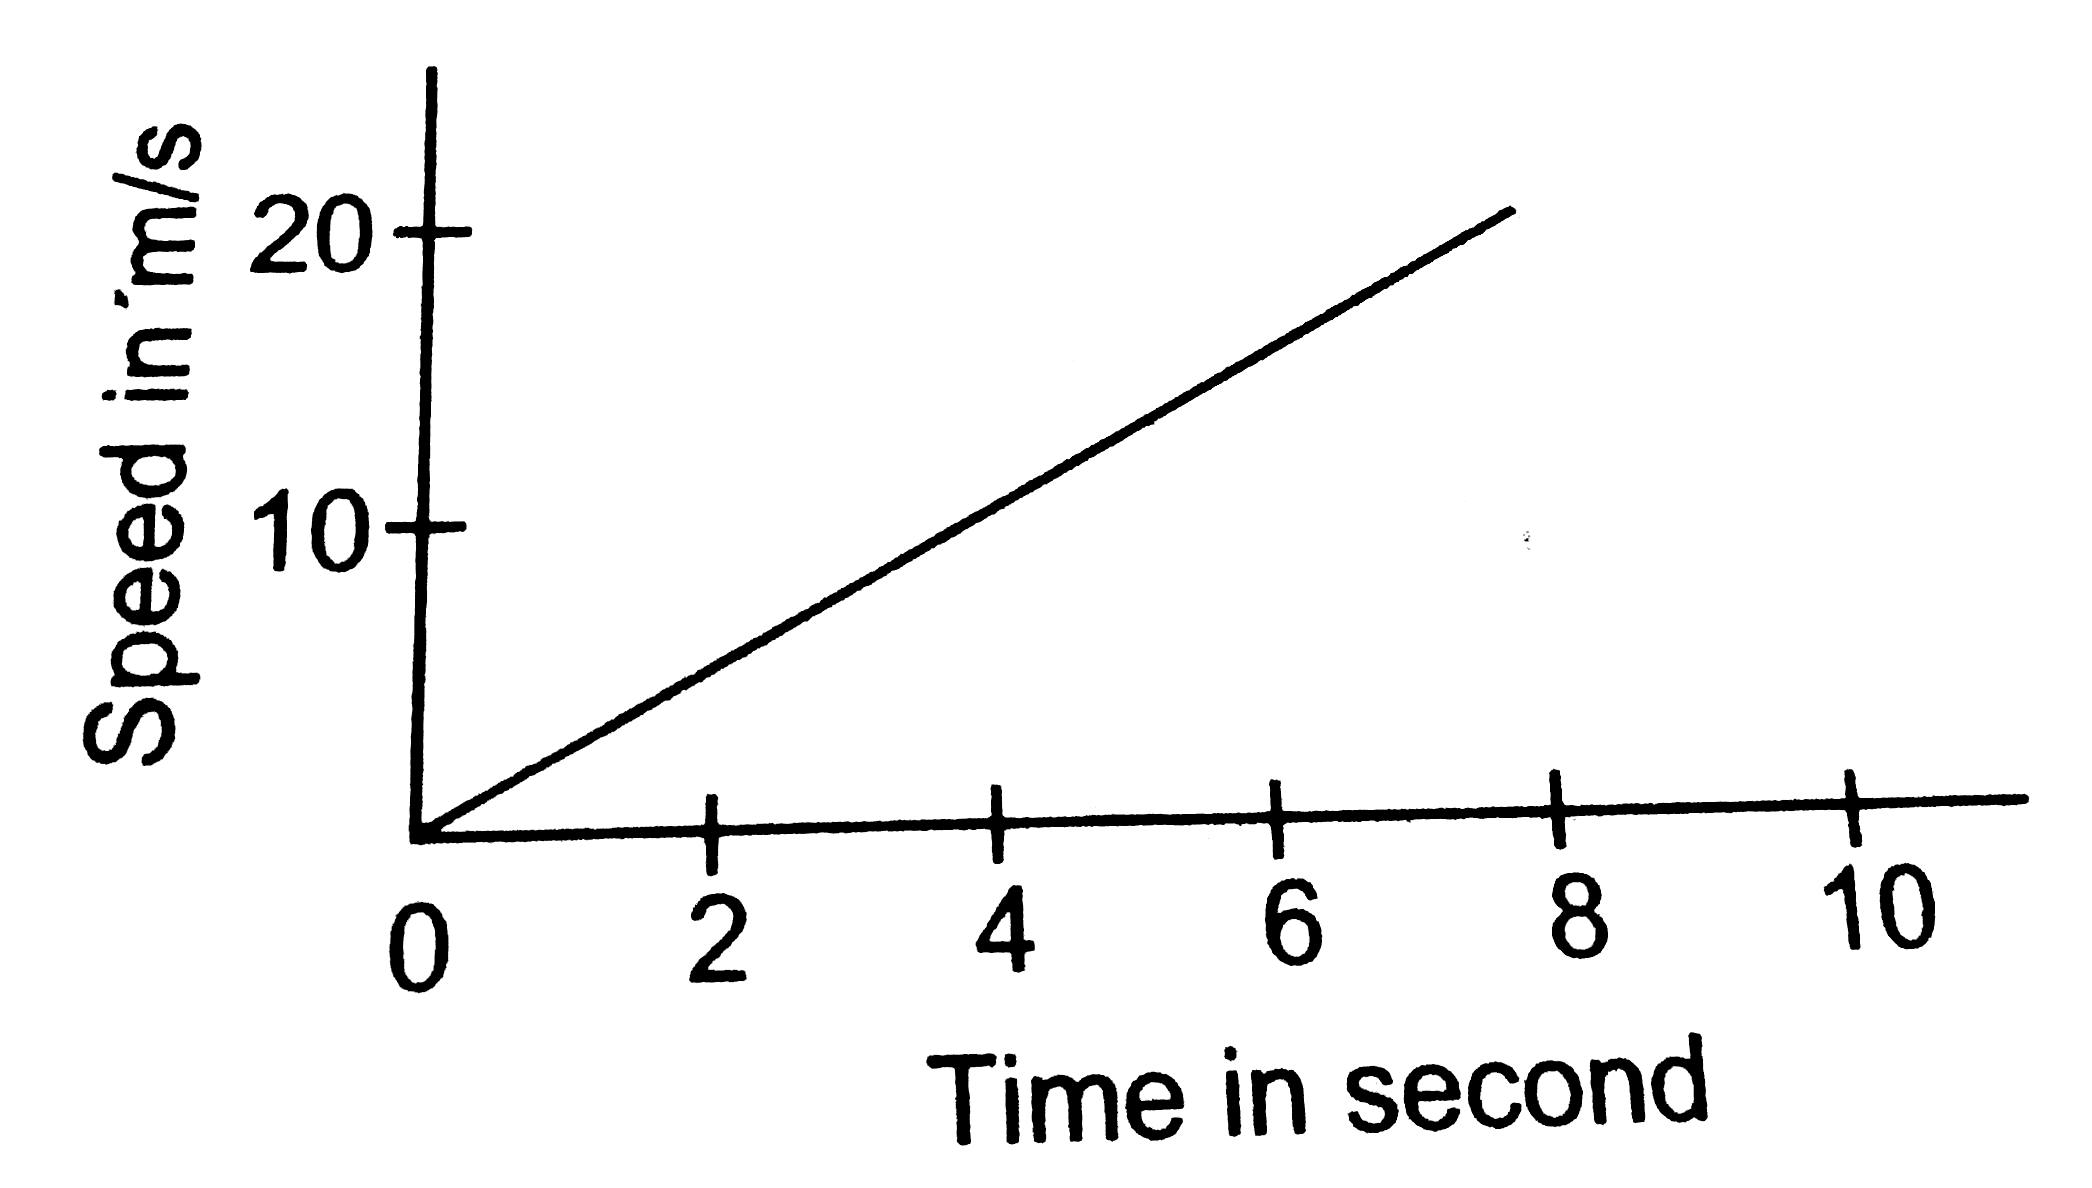
Find the distance travelled by the car in 8 seconds and its acceleration.
View SolutionThe speed of a car as a function of time is shown in figure.

Find the distance travelled by the car in 8 seconds and its acceleration.
View SolutionThe speed of a car increases uniformly from zero to 10ms−1 in 2s and then remains constant (figure)
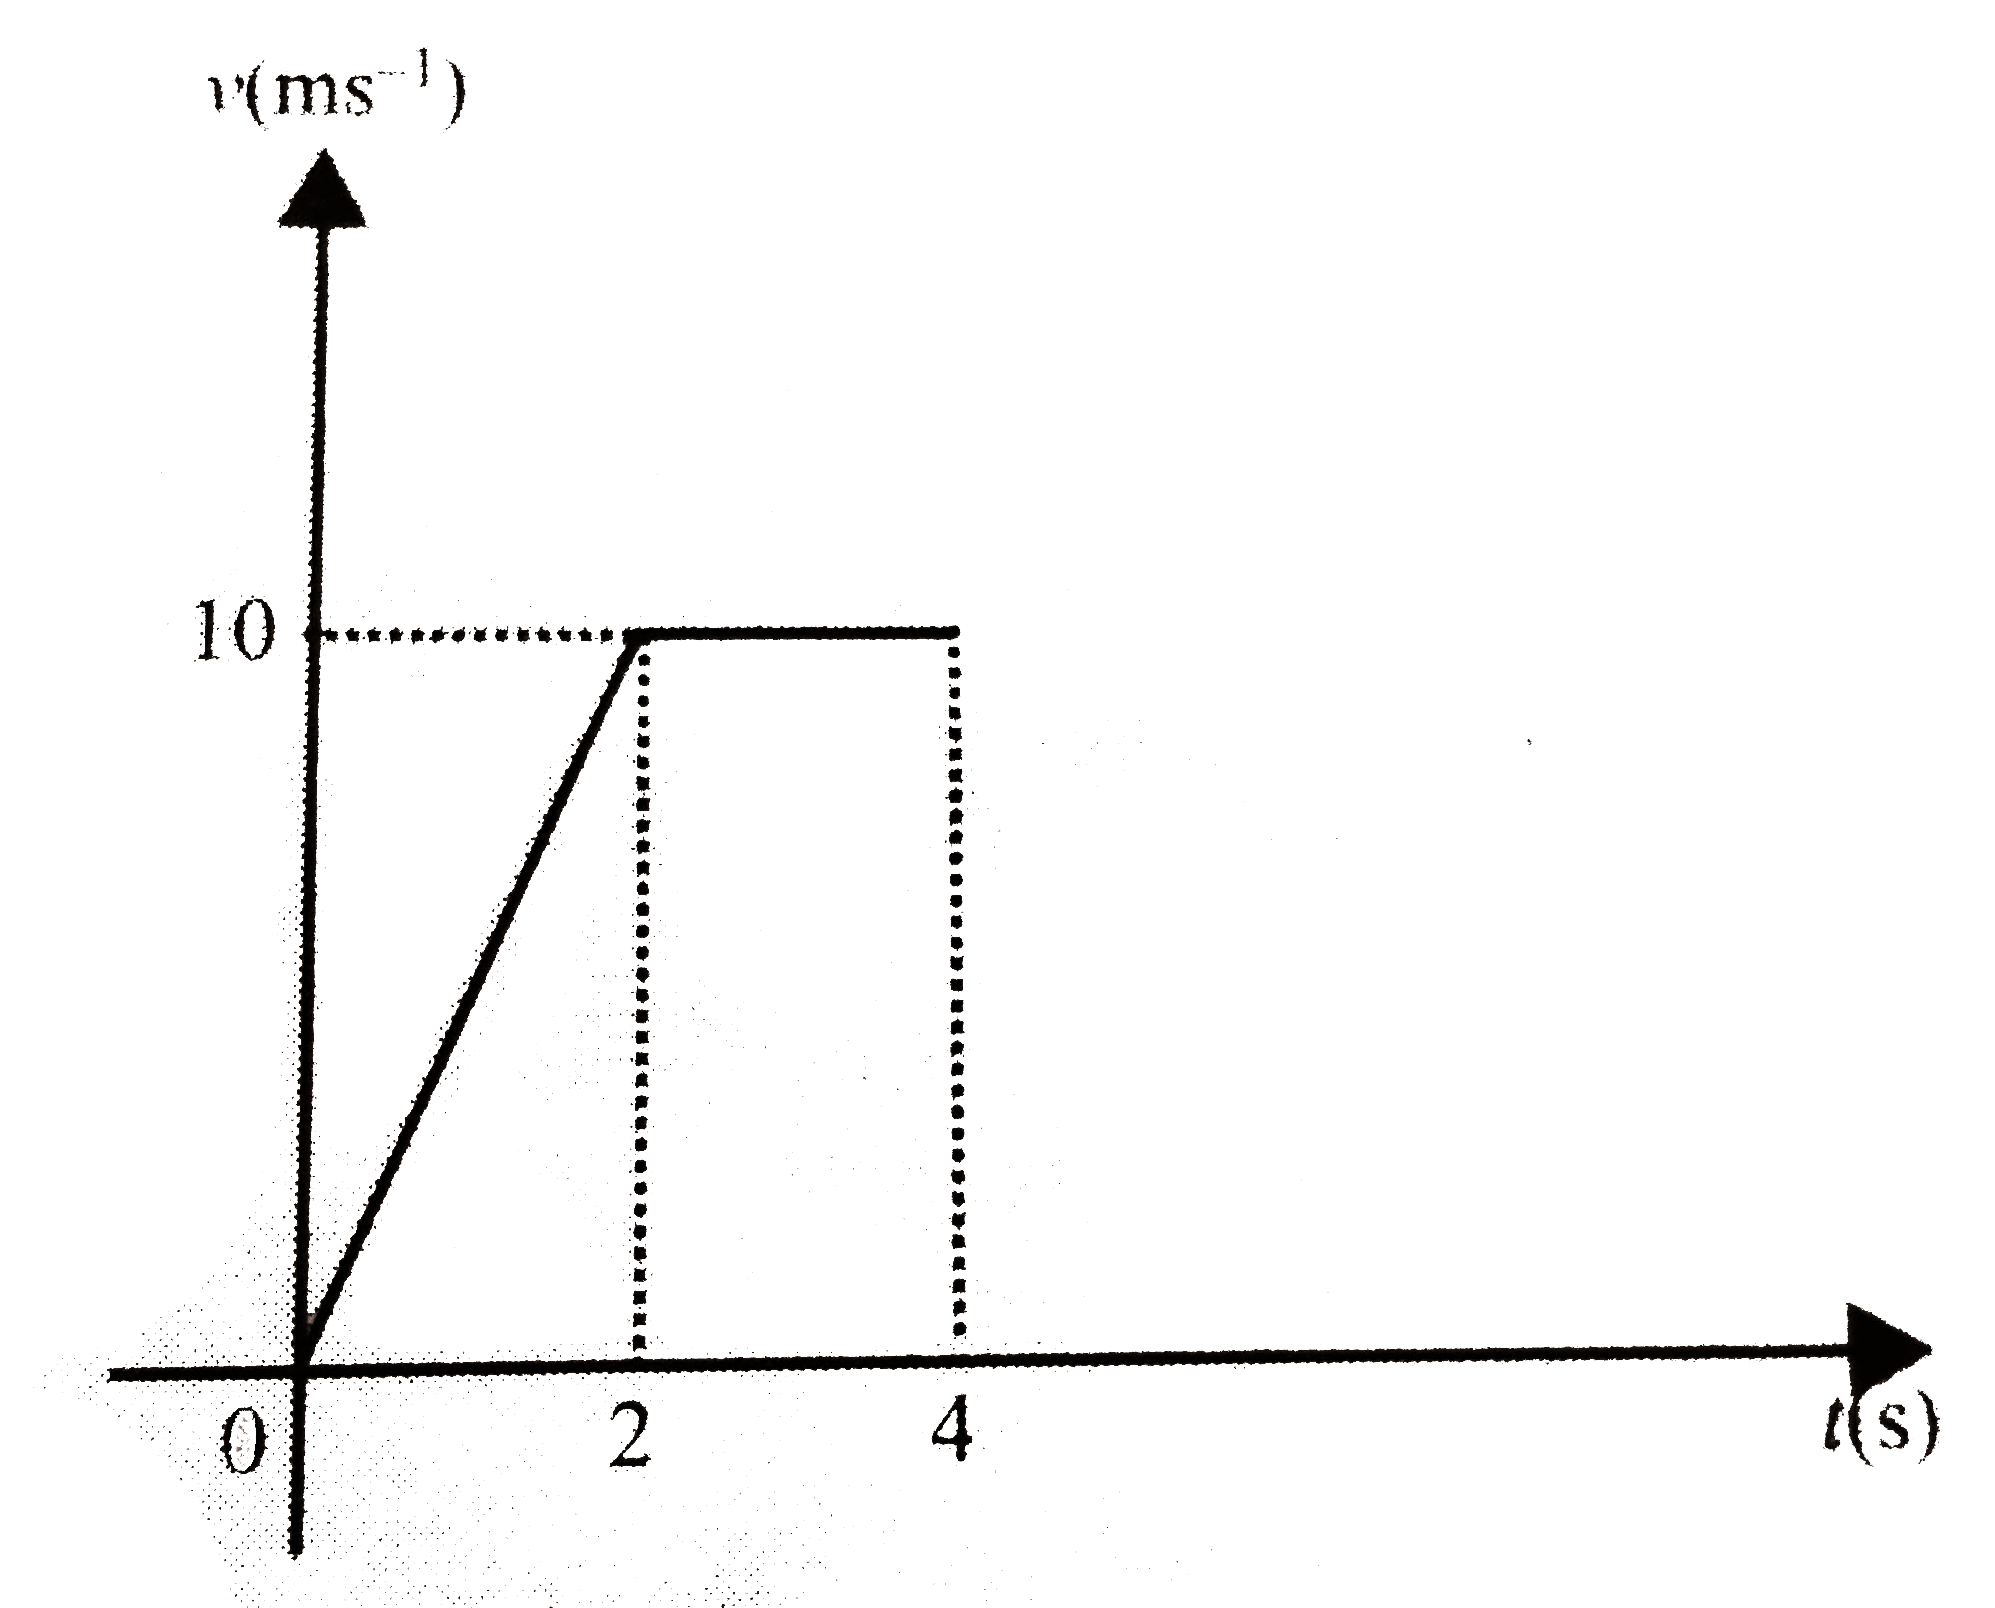
a. Find the distance travelled by the car in the first two seconds.
b. Find the distance travelled by the car in the next two seconds.
c. Find the total distance travelled in 4s.
View SolutionThe speed of a car increases uniformly from zero to 10ms−1 in 2s and then remains constant (figure)

a. Find the distance travelled by the car in the first two seconds.
b. Find the distance travelled by the car in the next two seconds.
c. Find the total distance travelled in 4s.
View SolutionThe speed-time graph for a car is shown is Figure
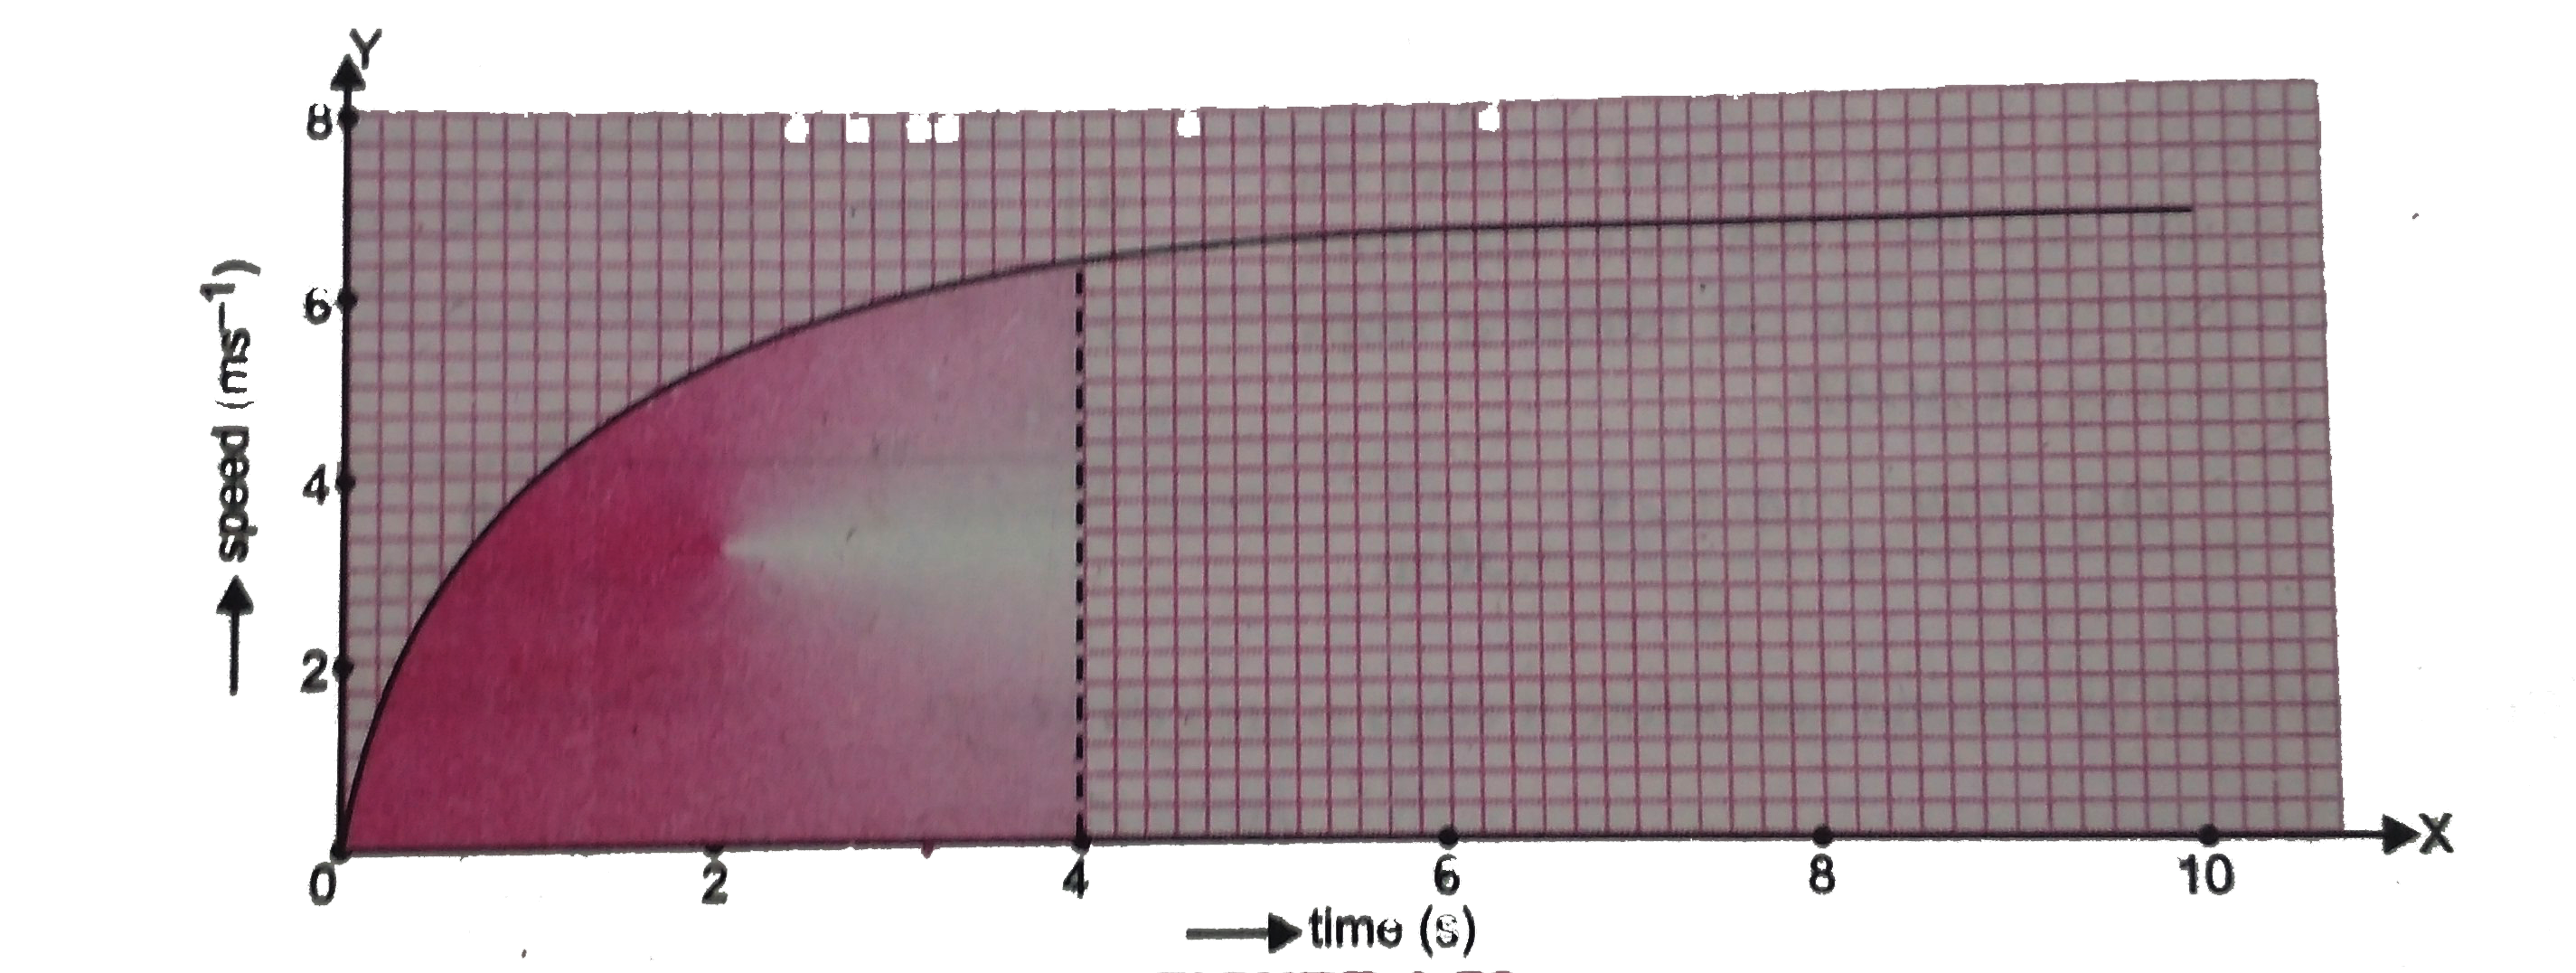
(a) Find how far does the car travel in the first 4 seconds. Shade the area on the graph that represents the distance travelled by the car during this period.
(b) Which part of the graph represents uniform motion of the car ?
View SolutionThe speed- time graph of a car is given in (figure) The car weights 1000kg
(a) What is the distance travelled by the car in first two seconds?
(b) What is the braking force applied at the end of 5seconds to bring the car to a stop within one second?
View Solution

