The distances travelled by a car at various time intervals are as follows :
Draw a distance-time graph for the car.

Step by step video & image solution for The distances travelled by a car at various time intervals are as follows : Draw a distance-time graph for the car. by Physics experts to help you in doubts & scoring excellent marks in Class 7 exams.
Updated on:21/07/2023Topper's Solved these Questions
- MOTION AND TIMEBook:LAKHMIR SINGH & MANJIT KAURChapter:MOTION AND TIMEExercise:EXERCISE
Explore 108 Videos
- LIGHTBook:LAKHMIR SINGH & MANJIT KAURChapter:LIGHTExercise:EXERCISEE
Explore 130 Videos
- WINDS, STORMS AND CYCLONESBook:LAKHMIR SINGH & MANJIT KAURChapter:WINDS, STORMS AND CYCLONESExercise:EXERCISE
Explore 92 Videos
Similar Questions
The distances travelled by a car at various time intervals are as follows :
What conclusion do you get from this graph about the nature of motion of the car ?

View SolutionThe following table gives the distances travelled by a car at various time- intervals . Study the table and draw a linear graph for the same.

From your graph, answer the questions given below:
(i) How much distance did the car cover during the period from 7.30 a.m. to 8 a.m.
(ii) What was the time when the car had covered a distance of 100km, since its start ?
(iii) How much distance had the car covered by 8.30 a.m. ?
View Solution
Knowledge Check
The distance x travelled by the car in above problem in time t is given by -
Ax=t22(αβα−β)Bx=t2(αβα+β)Cx=t2(α+βα−β)Dx=t22(αβα+β)If d denotes the distance covered by a car in time t and →s denotes the displacement by the car during the same time, then :
Ad≤∣∣→S∣∣Bd=∣∣→S∣∣ onlyCd≥∣∣→S∣∣Dd≤∣∣→S∣∣
The distance travelled by a body in different time intervals is tabulated as follows . Draw the distance time graphs.

View SolutionA car parked on road draw the shape of distance-time graph for it.
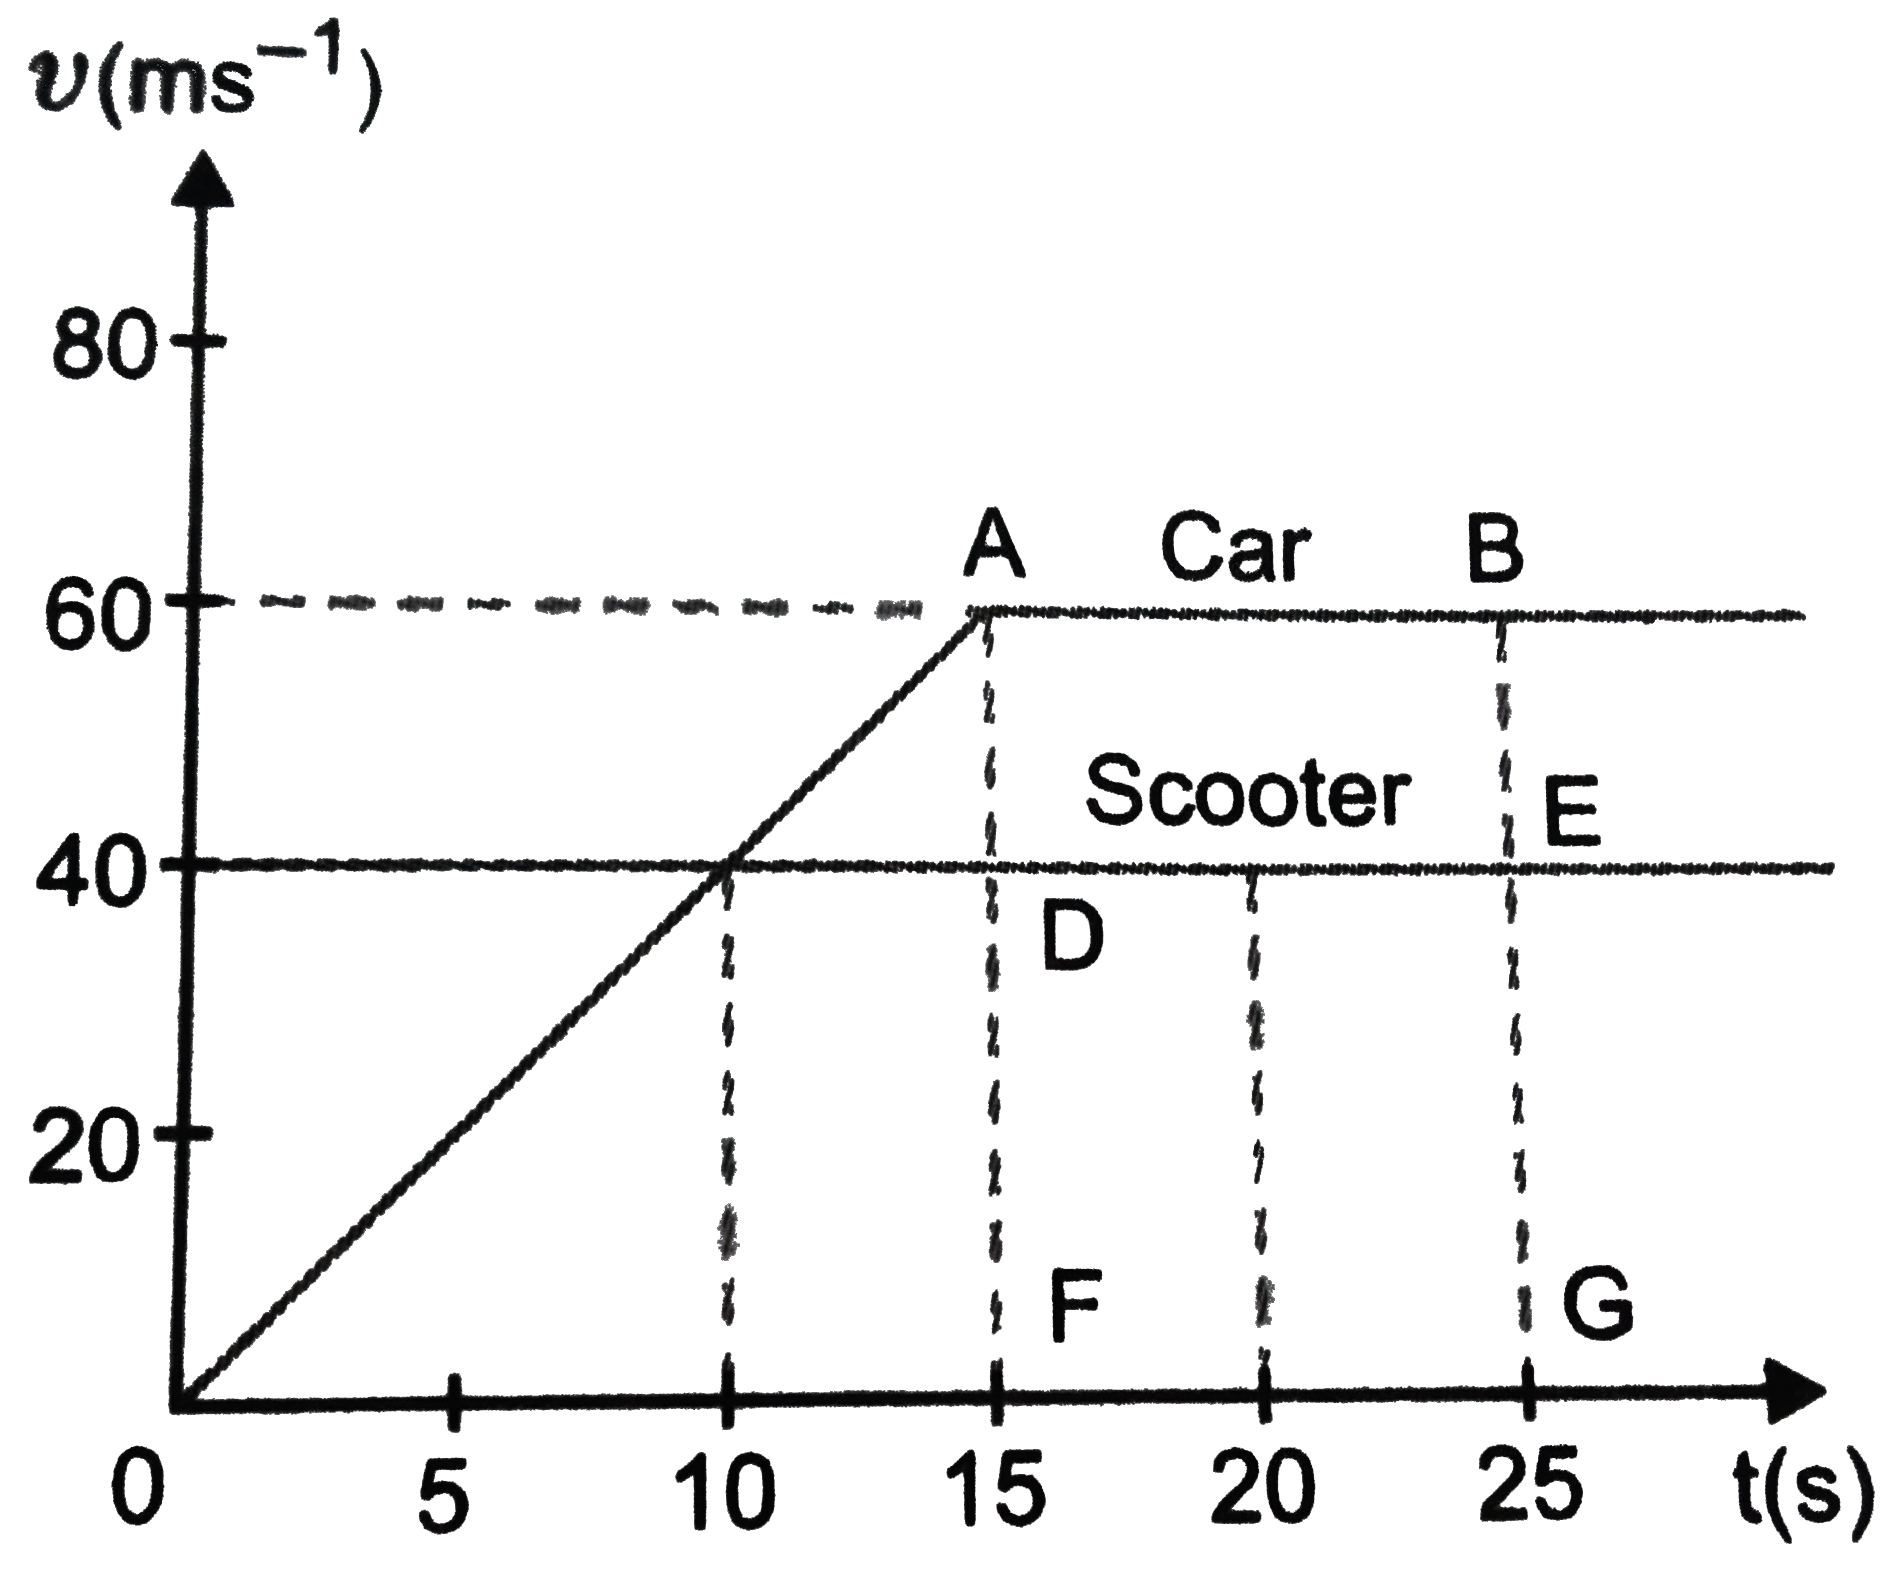
View SolutionAs soon as a car starts from rest in a certain dirction, a scooter moving with a uniform speed overtakes the car. Their velcity-time graphs are shown in Fig. 2 (b) .19.Calcutate<br>(a)thed⇔erencebetweenthedistancestravel≤dbythecarandthesc∞ter∈25 s.
(b) the time when car will catch up the secooter.
(c ) the distance of the car and scooter from the starting point at the meeting point.
 .
.
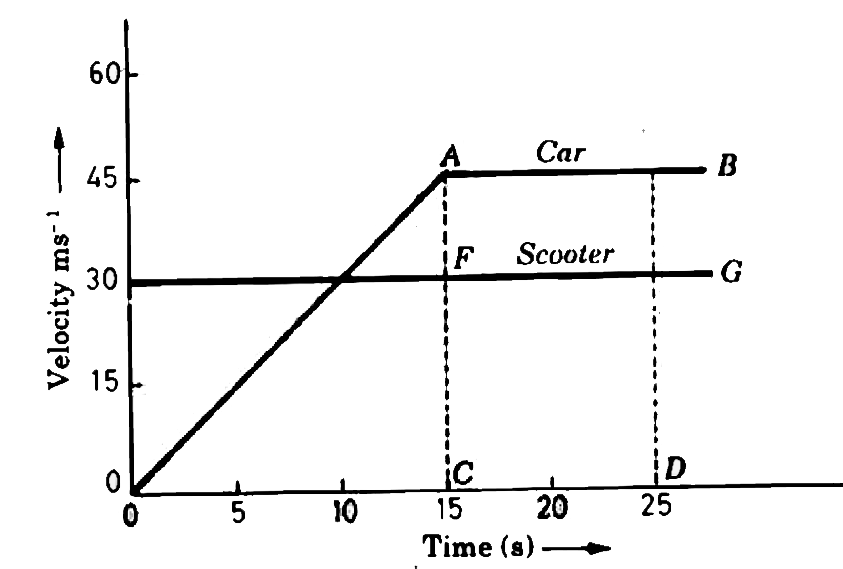
View SolutionAs soon as a car just starts from rest in a certain direction, a scooter moving with a uniform speed overtake the car. Their velocity- time graphs are shown in Fig. 3.38. Calculate (i) the difference between the distance travelled by the car and

the scooter in 15 s (ii) the time when the car will catch up the scooter and (iii) the distance of car and scooter from the starting point at that instant.
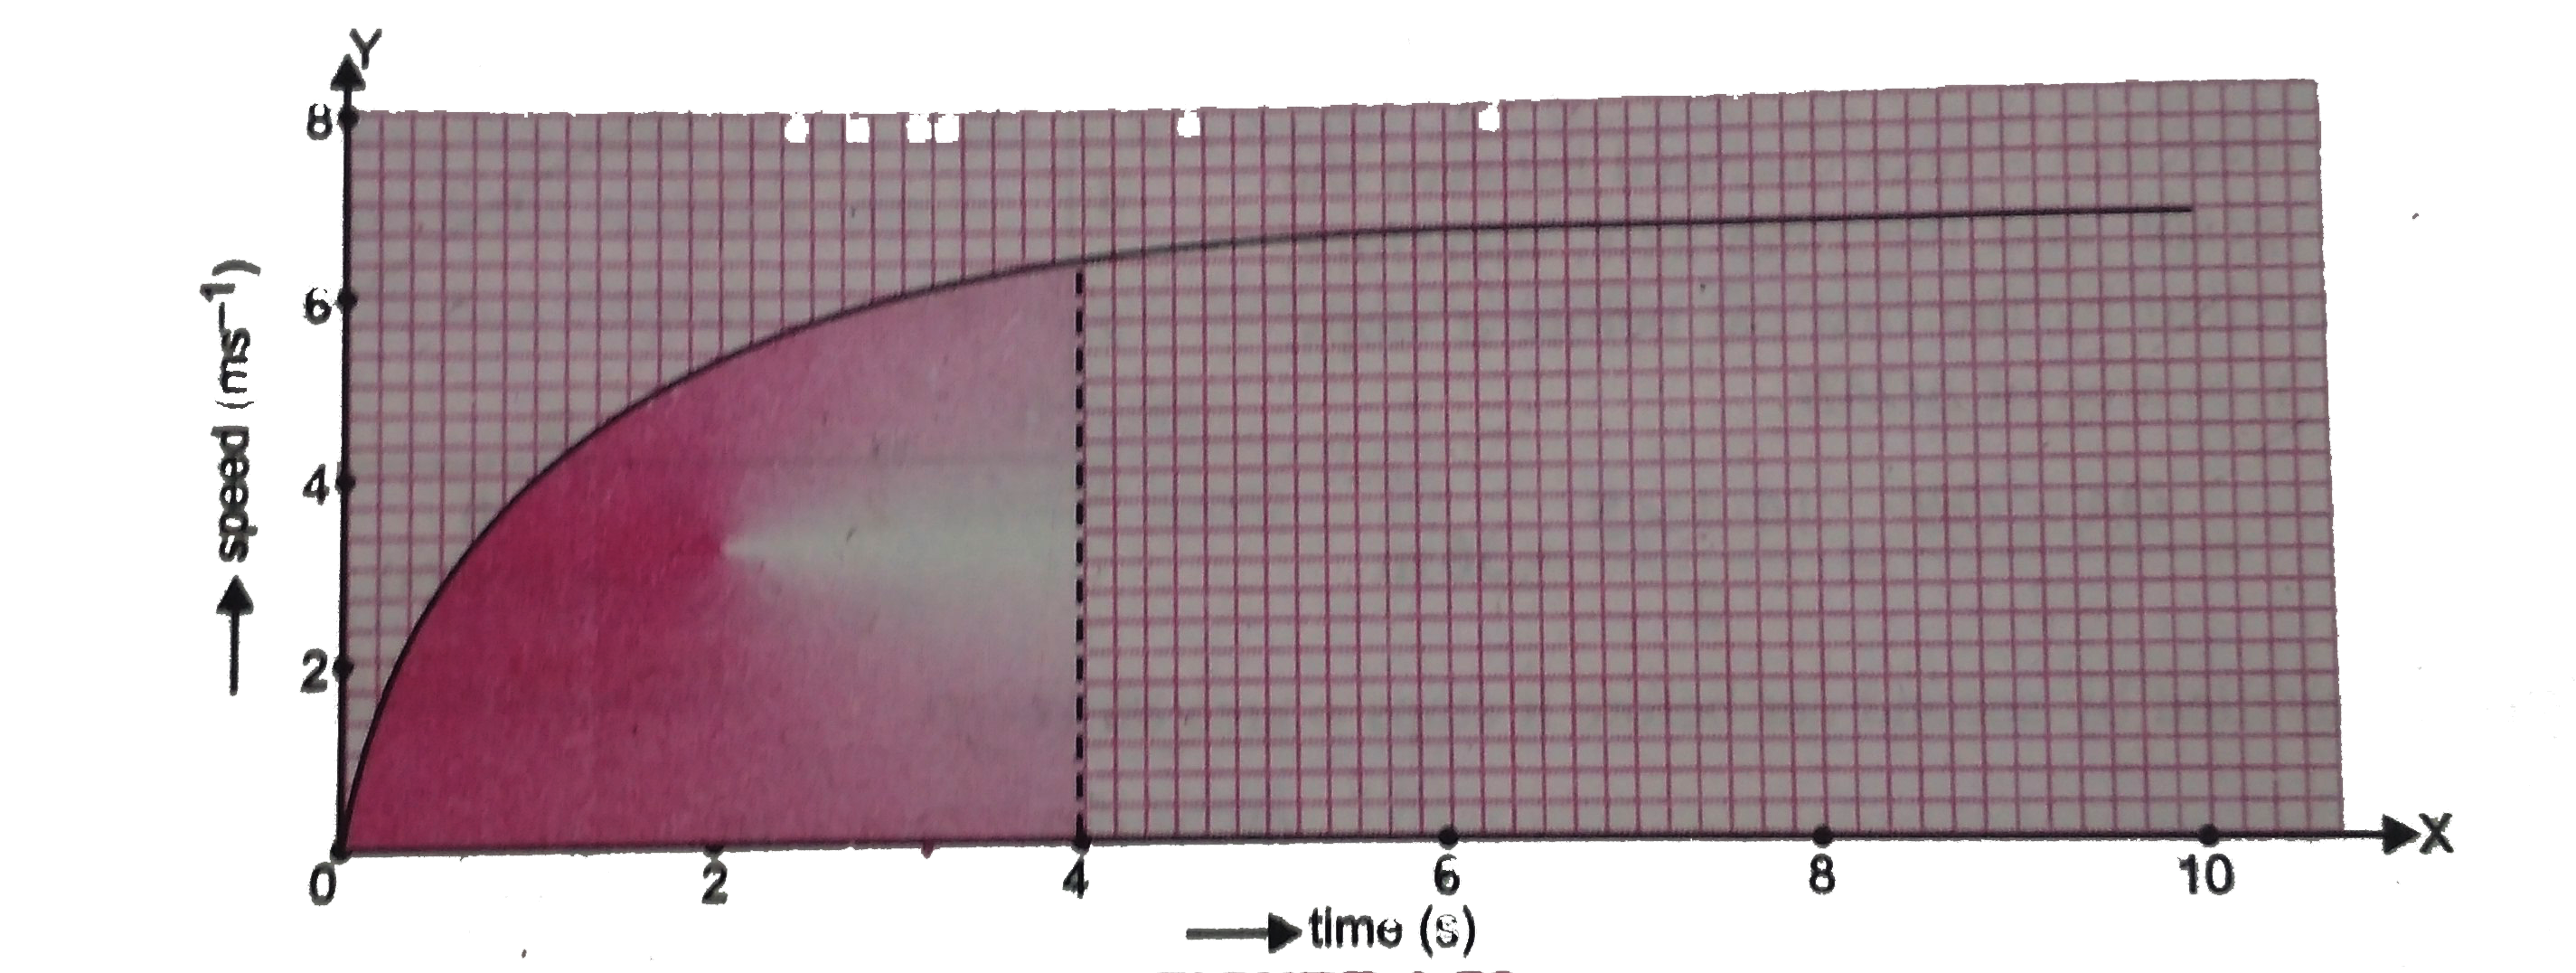
View SolutionThe speed-time graph for a car is shown is Figure

(a) Find how far does the car travel in the first 4 seconds. Shade the area on the graph that represents the distance travelled by the car during this period.
(b) Which part of the graph represents uniform motion of the car ?
View SolutionThe speed-time graph for a car is shown is Figure

(a) Find how far does the car travel in the first 4 seconds. Shade the area on the graph that represents the distance travelled by the car during this period.
(b) Which part of the graph represents uniform motion of the car ?
View Solution